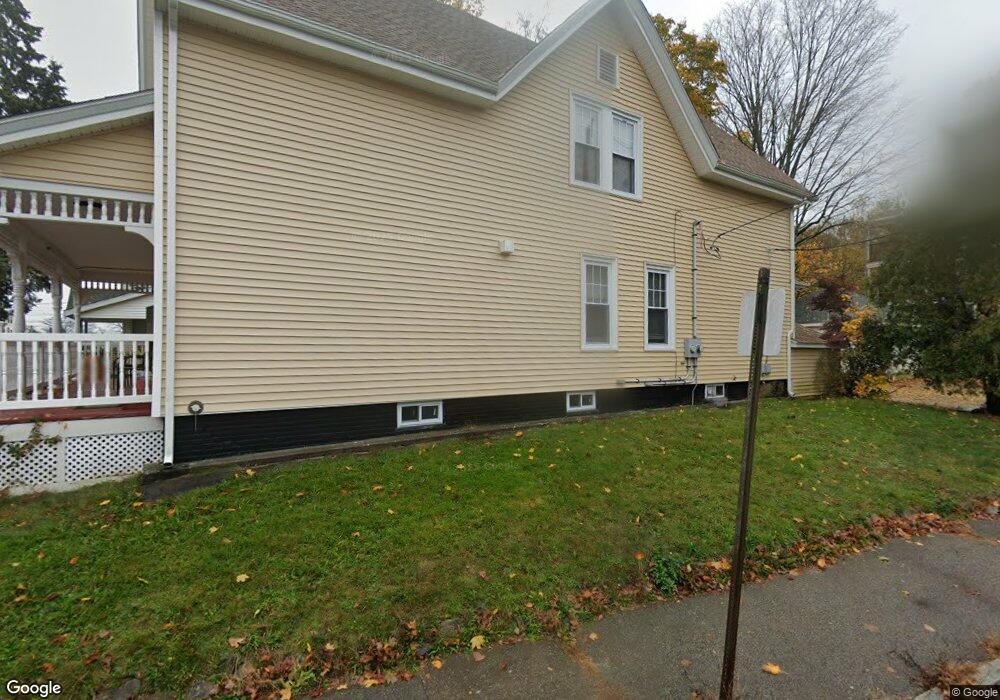
870 N Main St Brockton, MA 02301
Estimated Value: $352,150
1
Bed
2
Baths
2,700
Sq Ft
$130/Sq Ft
Est. Value
About This Home
This home is located at 870 N Main St, Brockton, MA 02301 and is currently estimated at $352,150, approximately $130 per square foot. 870 N Main St is a home located in Plymouth County with nearby schools including Raymond K-8 Elementary School, Louis F Angelo Elementary School, and Manthala George Jr. School.
Ownership History
Date
Name
Owned For
Owner Type
Purchase Details
Closed on
Feb 27, 2012
Sold by
Lincoln Rt
Bought by
Emh Recovery Inc
Current Estimated Value
Purchase Details
Closed on
Mar 5, 2007
Sold by
North Main T
Bought by
Lincoln Rt
Home Financials for this Owner
Home Financials are based on the most recent Mortgage that was taken out on this home.
Original Mortgage
$275,000
Interest Rate
6.27%
Mortgage Type
Commercial
Purchase Details
Closed on
Jan 31, 1992
Sold by
Massachusetts Bldg T
Bought by
Ranby Rt
Home Financials for this Owner
Home Financials are based on the most recent Mortgage that was taken out on this home.
Original Mortgage
$81,500
Interest Rate
8.44%
Mortgage Type
Commercial
Purchase Details
Closed on
Nov 17, 1989
Sold by
Feodorof Jennifer M
Bought by
Keating Diane C
Purchase Details
Closed on
Jun 15, 1989
Sold by
Atf Rt
Bought by
Jpj Rt
Create a Home Valuation Report for This Property
The Home Valuation Report is an in-depth analysis detailing your home's value as well as a comparison with similar homes in the area
Home Values in the Area
Average Home Value in this Area
Purchase History
| Date | Buyer | Sale Price | Title Company |
|---|---|---|---|
| Emh Recovery Inc | $140,000 | -- | |
| Lincoln Rt | $307,000 | -- | |
| Ranby Rt | $90,000 | -- | |
| Keating Diane C | $105,000 | -- | |
| Jpj Rt | $6,000 | -- |
Source: Public Records
Mortgage History
| Date | Status | Borrower | Loan Amount |
|---|---|---|---|
| Previous Owner | Jpj Rt | $275,000 | |
| Previous Owner | Jpj Rt | $95,000 | |
| Previous Owner | Jpj Rt | $81,500 |
Source: Public Records
Tax History Compared to Growth
Tax History
| Year | Tax Paid | Tax Assessment Tax Assessment Total Assessment is a certain percentage of the fair market value that is determined by local assessors to be the total taxable value of land and additions on the property. | Land | Improvement |
|---|---|---|---|---|
| 2025 | -- | $482,500 | $166,900 | $315,600 |
| 2024 | -- | $452,600 | $151,800 | $300,800 |
| 2023 | $0 | $404,600 | $131,100 | $273,500 |
| 2022 | $0 | $379,600 | $131,100 | $248,500 |
| 2021 | $0 | $338,400 | $124,800 | $213,600 |
| 2020 | $0 | $311,000 | $118,900 | $192,100 |
| 2019 | $0 | $286,200 | $118,900 | $167,300 |
| 2018 | $0 | $286,200 | $118,900 | $167,300 |
| 2017 | $0 | $273,700 | $118,900 | $154,800 |
| 2016 | -- | $250,750 | $118,900 | $131,850 |
| 2015 | -- | $250,750 | $118,900 | $131,850 |
| 2014 | -- | $250,760 | $118,900 | $131,860 |
Source: Public Records
Map
Nearby Homes
- 864 N Main St
- 14 Martland Ave
- 856 N Main St
- 22 Martland Ave
- 22 Martland Ave Unit 2
- 863 N Main St
- 863 N Main St Unit 1
- 28 Martland Ave
- 885 N Main St
- 12 Argyle Ave
- 25 Martland Ave Unit 2
- 25 Martland Ave Unit 1
- 13 Snell St
- 13 Snell St Unit 13 Snell st
- 14 Argyle Ave Unit 3
- 32 Martland Ave
- 32 Martland Ave Unit 1
- 32 Martland Ave Unit 2
- 31 Martland Ave
- 17 Snell St