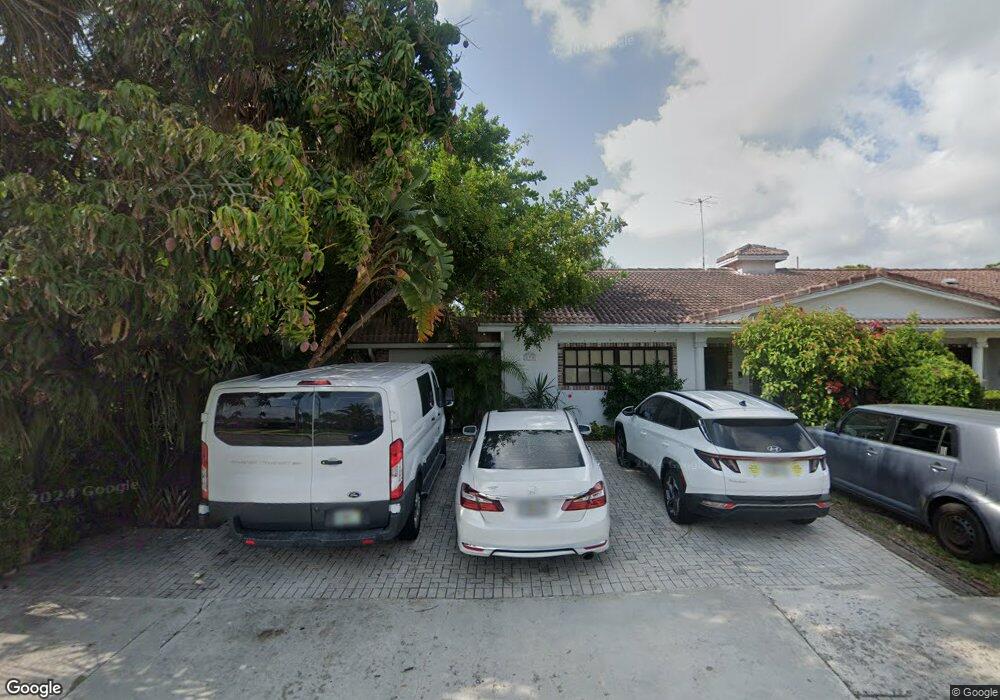
870 SE 2nd Ct Deerfield Beach, FL 33441
Estimated Value: $421,123 - $681,000
2
Beds
1
Bath
1,555
Sq Ft
$348/Sq Ft
Est. Value
About This Home
This home is located at 870 SE 2nd Ct, Deerfield Beach, FL 33441 and is currently estimated at $541,781, approximately $348 per square foot. 870 SE 2nd Ct is a home located in Broward County with nearby schools including Deerfield Beach Elementary School, Deerfield Beach Middle School, and Deerfield Beach High School.
Ownership History
Date
Name
Owned For
Owner Type
Purchase Details
Closed on
May 11, 2011
Sold by
Pendleton Angeline J and Johnston Matthew S
Bought by
Verola Marcus
Current Estimated Value
Home Financials for this Owner
Home Financials are based on the most recent Mortgage that was taken out on this home.
Original Mortgage
$100,388
Outstanding Balance
$70,941
Interest Rate
5.25%
Mortgage Type
FHA
Estimated Equity
$470,840
Purchase Details
Closed on
Nov 25, 2003
Sold by
Fortin Pierre and Fortin Carole
Bought by
Pendleton Angeline J
Purchase Details
Closed on
Jun 28, 1996
Sold by
Allaire Joseph P
Bought by
Fortin Pierre and Fortin Carole
Home Financials for this Owner
Home Financials are based on the most recent Mortgage that was taken out on this home.
Original Mortgage
$67,500
Interest Rate
8.05%
Purchase Details
Closed on
Nov 16, 1993
Sold by
Allaire Joseph P
Bought by
Allaire Joseph P and Allaire Sylvie
Create a Home Valuation Report for This Property
The Home Valuation Report is an in-depth analysis detailing your home's value as well as a comparison with similar homes in the area
Home Values in the Area
Average Home Value in this Area
Purchase History
| Date | Buyer | Sale Price | Title Company |
|---|---|---|---|
| Verola Marcus | $103,000 | Attorney | |
| Pendleton Angeline J | $190,000 | Superior Title & Guaranty Co | |
| Fortin Pierre | $67,500 | -- | |
| Allaire Joseph P | -- | -- |
Source: Public Records
Mortgage History
| Date | Status | Borrower | Loan Amount |
|---|---|---|---|
| Open | Verola Marcus | $100,388 | |
| Previous Owner | Fortin Pierre | $67,500 |
Source: Public Records
Tax History Compared to Growth
Tax History
| Year | Tax Paid | Tax Assessment Tax Assessment Total Assessment is a certain percentage of the fair market value that is determined by local assessors to be the total taxable value of land and additions on the property. | Land | Improvement |
|---|---|---|---|---|
| 2025 | $7,175 | $317,480 | -- | -- |
| 2024 | $6,405 | $317,480 | -- | -- |
| 2023 | $6,405 | $262,390 | $0 | $0 |
| 2022 | $5,283 | $238,540 | $0 | $0 |
| 2021 | $4,742 | $216,860 | $0 | $0 |
| 2020 | $4,386 | $212,120 | $16,000 | $196,120 |
| 2019 | $4,139 | $208,090 | $16,000 | $192,090 |
| 2018 | $3,733 | $195,540 | $16,000 | $179,540 |
| 2017 | $3,425 | $148,130 | $0 | $0 |
| 2016 | $3,187 | $134,670 | $0 | $0 |
| 2015 | $2,962 | $122,430 | $0 | $0 |
| 2014 | $2,604 | $105,460 | $0 | $0 |
| 2013 | -- | $95,880 | $16,000 | $79,880 |
Source: Public Records
Map
Nearby Homes
- 262 SE 9th Ave Unit 1-4
- 271 SE 8th Ave
- 269 SE 8th Ave
- 367 S Federal Hwy Unit 209
- 367 S Federal Hwy Unit 323
- 367 S Federal Hwy Unit 326
- 367 S Federal Hwy Unit 321
- 367 S Federal Hwy Unit 206
- 711 SE 3rd St
- 29 SE 8th Ave
- 17 SE 9th Ave
- 8 SE 8th Ave
- 43 SE 7th Ave
- 949 SE 5th St
- 500 SE 4th St
- 370 SE 2nd Ave Unit G3
- 605 SE 8th Ave
- 94 SE 3rd Ave Unit 94-96
- 390 SE 2nd Ave Unit J3
- 1007 SE 6th St
- 860 SE 2nd Ct
- 263 SE 9th Ave
- 274 SE 8th Terrace
- 270 SE 8th Terrace Unit n/a
- 270 SE 8th Terrace
- 275 SE 9th Ave
- 248 SE 8th Terrace
- 881 SE 2nd Ct
- 871 SE 2nd Ct
- 263 SE 8th Terrace
- 279 SE 8th Terrace
- 279 SE 8th Terrace Unit A
- 279 B SE 8th Terrace
- 275 SE 8th Terrace
- 275 SE 8th Terrace Unit A
- 874 SE 2nd Place Unit 1
- 886 SE 2nd Place Unit 1
- 236 SE 8th Terrace
- 274 SE 9th Ave
- 862 SE 2nd Place