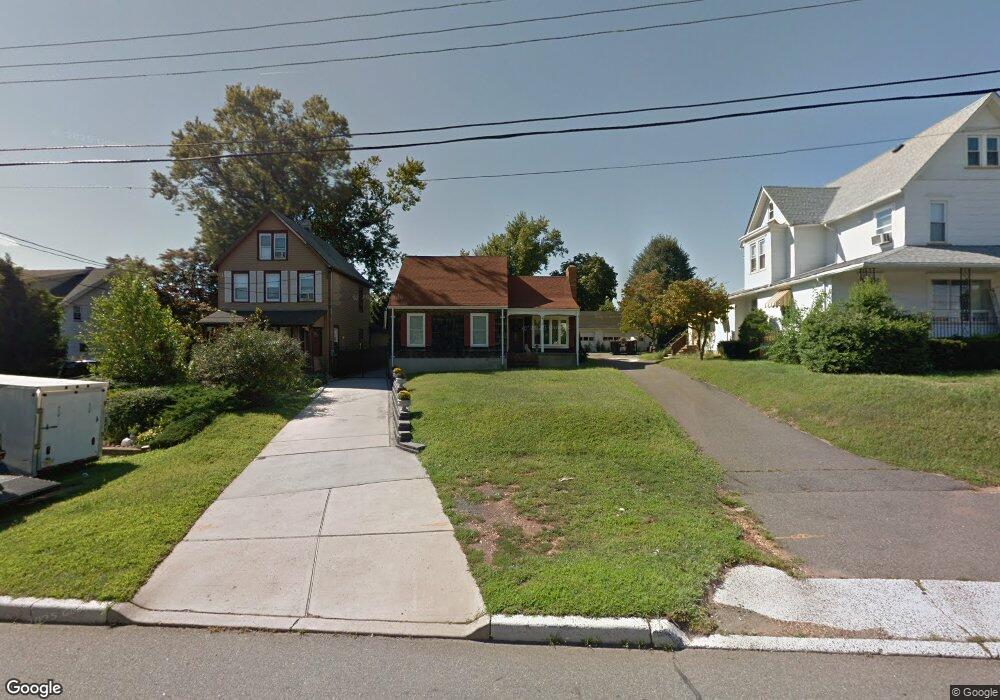
870 Upper Main St South Amboy, NJ 08879
Estimated Value: $396,000 - $528,000
3
Beds
3
Baths
--
Sq Ft
9,148
Sq Ft Lot
About This Home
This home is located at 870 Upper Main St, South Amboy, NJ 08879 and is currently estimated at $471,667. 870 Upper Main St is a home located in Middlesex County with nearby schools including Sayreville War Memorial High School, St. Mary Elementary School, and New Road School of Parlin.
Ownership History
Date
Name
Owned For
Owner Type
Purchase Details
Closed on
May 13, 2010
Sold by
Peck Franklin
Bought by
Amador Armenio
Current Estimated Value
Home Financials for this Owner
Home Financials are based on the most recent Mortgage that was taken out on this home.
Original Mortgage
$174,900
Interest Rate
4.36%
Mortgage Type
New Conventional
Purchase Details
Closed on
Jul 6, 2001
Sold by
Maciorowski Edward
Bought by
Peck Franklin
Home Financials for this Owner
Home Financials are based on the most recent Mortgage that was taken out on this home.
Original Mortgage
$140,000
Interest Rate
7.2%
Create a Home Valuation Report for This Property
The Home Valuation Report is an in-depth analysis detailing your home's value as well as a comparison with similar homes in the area
Home Values in the Area
Average Home Value in this Area
Purchase History
| Date | Buyer | Sale Price | Title Company |
|---|---|---|---|
| Amador Armenio | $224,900 | None Available | |
| Peck Franklin | $175,000 | -- |
Source: Public Records
Mortgage History
| Date | Status | Borrower | Loan Amount |
|---|---|---|---|
| Previous Owner | Amador Armenio | $174,900 | |
| Previous Owner | Peck Franklin | $140,000 |
Source: Public Records
Tax History Compared to Growth
Tax History
| Year | Tax Paid | Tax Assessment Tax Assessment Total Assessment is a certain percentage of the fair market value that is determined by local assessors to be the total taxable value of land and additions on the property. | Land | Improvement |
|---|---|---|---|---|
| 2025 | $7,863 | $128,800 | $49,000 | $79,800 |
| 2024 | $7,646 | $128,800 | $49,000 | $79,800 |
| 2023 | $7,646 | $128,800 | $49,000 | $79,800 |
| 2022 | $7,142 | $128,800 | $49,000 | $79,800 |
| 2021 | $5,791 | $128,800 | $49,000 | $79,800 |
| 2020 | $6,884 | $128,800 | $49,000 | $79,800 |
| 2019 | $6,740 | $128,800 | $49,000 | $79,800 |
| 2018 | $6,619 | $128,800 | $49,000 | $79,800 |
| 2017 | $6,466 | $128,800 | $49,000 | $79,800 |
| 2016 | $6,293 | $128,800 | $49,000 | $79,800 |
| 2015 | $6,150 | $128,800 | $49,000 | $79,800 |
| 2014 | $5,985 | $128,800 | $49,000 | $79,800 |
Source: Public Records
Map
Nearby Homes