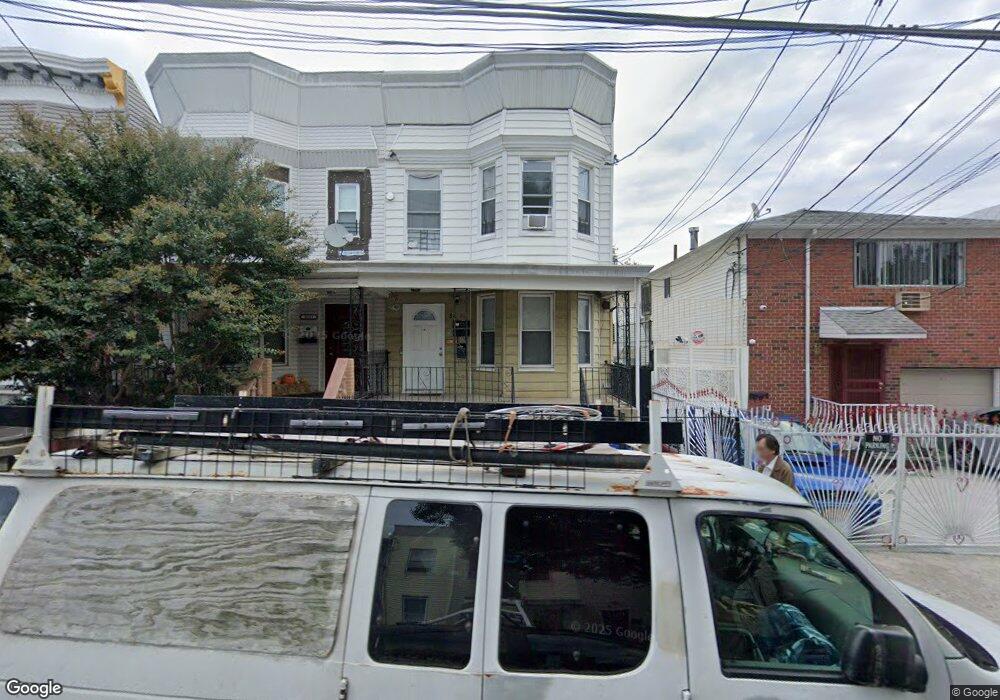
8701 77th St Woodhaven, NY 11421
Woodhaven NeighborhoodEstimated Value: $870,000 - $988,000
7
Beds
7
Baths
2,086
Sq Ft
$446/Sq Ft
Est. Value
About This Home
This home is located at 8701 77th St, Woodhaven, NY 11421 and is currently estimated at $931,007, approximately $446 per square foot. 8701 77th St is a home located in Queens County with nearby schools including P.S. 97Q The Forest Park School, Jhs 210 Elizabeth Blackwell, and St. Thomas the Apostle Catholic Academy.
Ownership History
Date
Name
Owned For
Owner Type
Purchase Details
Closed on
Jul 26, 2016
Sold by
Jurado Marlon R and Jurado Marisol Rosero
Bought by
Huang Hui Qun and Wen Yu Kun
Current Estimated Value
Home Financials for this Owner
Home Financials are based on the most recent Mortgage that was taken out on this home.
Original Mortgage
$300,000
Outstanding Balance
$239,981
Interest Rate
3.56%
Mortgage Type
Purchase Money Mortgage
Estimated Equity
$691,026
Create a Home Valuation Report for This Property
The Home Valuation Report is an in-depth analysis detailing your home's value as well as a comparison with similar homes in the area
Home Values in the Area
Average Home Value in this Area
Purchase History
| Date | Buyer | Sale Price | Title Company |
|---|---|---|---|
| Huang Hui Qun | $510,000 | -- |
Source: Public Records
Mortgage History
| Date | Status | Borrower | Loan Amount |
|---|---|---|---|
| Open | Huang Hui Qun | $300,000 |
Source: Public Records
Tax History Compared to Growth
Tax History
| Year | Tax Paid | Tax Assessment Tax Assessment Total Assessment is a certain percentage of the fair market value that is determined by local assessors to be the total taxable value of land and additions on the property. | Land | Improvement |
|---|---|---|---|---|
| 2025 | $6,994 | $36,869 | $7,933 | $28,936 |
| 2024 | $6,994 | $34,824 | $8,976 | $25,848 |
| 2023 | $6,980 | $34,752 | $9,062 | $25,690 |
| 2022 | $6,545 | $54,120 | $13,440 | $40,680 |
| 2021 | $6,509 | $52,680 | $13,440 | $39,240 |
| 2020 | $6,503 | $49,980 | $13,440 | $36,540 |
| 2019 | $6,071 | $42,900 | $13,440 | $29,460 |
| 2018 | $5,903 | $28,960 | $9,934 | $19,026 |
| 2017 | $5,569 | $27,321 | $9,951 | $17,370 |
| 2016 | $4,843 | $27,321 | $9,951 | $17,370 |
| 2015 | $2,889 | $25,603 | $11,697 | $13,906 |
| 2014 | $2,889 | $24,184 | $13,034 | $11,150 |
Source: Public Records
Map
Nearby Homes