Estimated Value: $989,000 - $1,449,788
7
Beds
6
Baths
5,754
Sq Ft
$207/Sq Ft
Est. Value
About This Home
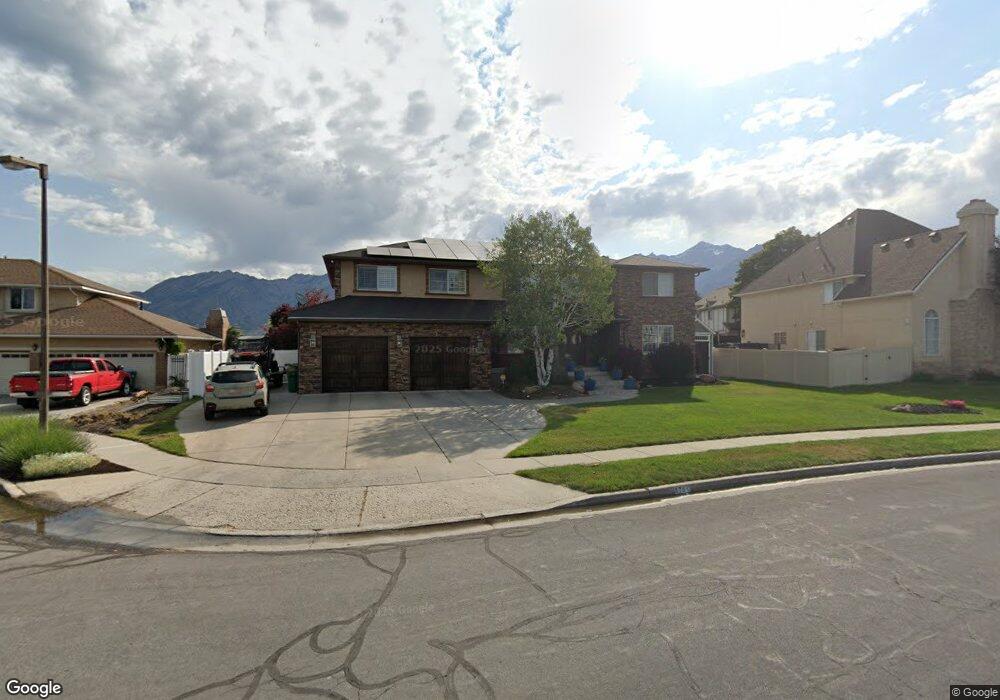
This home is located at 8701 Glider Ln, Sandy, UT 84093 and is currently estimated at $1,191,947, approximately $207 per square foot. 8701 Glider Ln is a home located in Salt Lake County with nearby schools including Silver Mesa Elementary School, Albion Middle School, and Hillcrest High School.
Ownership History
Date
Name
Owned For
Owner Type
Purchase Details
Closed on
Oct 15, 2019
Sold by
Swapp David W and Swapp Stacy D
Bought by
Young Jacob and Young Stacy
Current Estimated Value
Home Financials for this Owner
Home Financials are based on the most recent Mortgage that was taken out on this home.
Original Mortgage
$570,000
Outstanding Balance
$500,568
Interest Rate
3.62%
Mortgage Type
New Conventional
Estimated Equity
$691,379
Purchase Details
Closed on
Apr 14, 2017
Sold by
Rutheford Scott and Rutheford Rachelle D
Bought by
Swapp David W and Swapp Stacy D
Home Financials for this Owner
Home Financials are based on the most recent Mortgage that was taken out on this home.
Original Mortgage
$597,000
Interest Rate
4.1%
Mortgage Type
New Conventional
Purchase Details
Closed on
Mar 10, 2015
Sold by
Rutherford Scott and Rutherford Rachelle Darlene
Bought by
Rutherford Scott and Rutherford Rachelle D
Home Financials for this Owner
Home Financials are based on the most recent Mortgage that was taken out on this home.
Original Mortgage
$417,000
Interest Rate
3.61%
Mortgage Type
New Conventional
Purchase Details
Closed on
Oct 17, 2012
Sold by
Rutherford Rachelle Darlene and Rutherford Scott
Bought by
Rutherford Scott and Rutherford Rachelle Darlene
Home Financials for this Owner
Home Financials are based on the most recent Mortgage that was taken out on this home.
Original Mortgage
$557,844
Interest Rate
3.37%
Mortgage Type
FHA
Purchase Details
Closed on
Apr 14, 2009
Sold by
Rutherford Rachelle D
Bought by
Rutherford Rachelle Darlene and Rutherford Scott
Home Financials for this Owner
Home Financials are based on the most recent Mortgage that was taken out on this home.
Original Mortgage
$424,297
Interest Rate
5.17%
Mortgage Type
FHA
Purchase Details
Closed on
May 12, 2005
Sold by
Scarpa Ronald and Scarpa Mary L
Bought by
Rutherford Rachelle Darlene and Rutherford Scott
Home Financials for this Owner
Home Financials are based on the most recent Mortgage that was taken out on this home.
Original Mortgage
$373,600
Interest Rate
6.02%
Mortgage Type
New Conventional
Purchase Details
Closed on
Oct 23, 2002
Sold by
Scarpa Ronald J and Scarpa Mary L
Bought by
Scarpa Ronald and Scarpa Mary L
Home Financials for this Owner
Home Financials are based on the most recent Mortgage that was taken out on this home.
Original Mortgage
$300,532
Interest Rate
6.09%
Create a Home Valuation Report for This Property
The Home Valuation Report is an in-depth analysis detailing your home's value as well as a comparison with similar homes in the area
Home Values in the Area
Average Home Value in this Area
Purchase History
| Date | Buyer | Sale Price | Title Company |
|---|---|---|---|
| Young Jacob | -- | Eagle Gate Title Ins Agcy | |
| Swapp David W | -- | Vanguard Title | |
| Rutherford Scott | -- | Titan Title Ins Agcy Inc | |
| Rutherford Scott | -- | Titan Title Ins Agc Inc | |
| Rutherford Rachelle Darlene | -- | Investors Title Ins Agency | |
| Rutherford Rachelle D | -- | Investors Title Ins Agency | |
| Rutherford Rachelle Darlene | -- | Guardian Title | |
| Scarpa Ronald | -- | Surety Title |
Source: Public Records
Mortgage History
| Date | Status | Borrower | Loan Amount |
|---|---|---|---|
| Open | Young Jacob | $570,000 | |
| Previous Owner | Swapp David W | $597,000 | |
| Previous Owner | Rutherford Scott | $417,000 | |
| Previous Owner | Rutherford Scott | $557,844 | |
| Previous Owner | Rutherford Rachelle D | $424,297 | |
| Previous Owner | Rutherford Rachelle Darlene | $373,600 | |
| Previous Owner | Scarpa Ronald | $300,532 | |
| Closed | Scarpa Ronald | $52,000 |
Source: Public Records
Tax History
| Year | Tax Paid | Tax Assessment Tax Assessment Total Assessment is a certain percentage of the fair market value that is determined by local assessors to be the total taxable value of land and additions on the property. | Land | Improvement |
|---|---|---|---|---|
| 2025 | $5,883 | $1,146,200 | $356,100 | $790,100 |
| 2024 | $5,883 | $1,102,800 | $342,700 | $760,100 |
| 2023 | $5,154 | $964,400 | $329,600 | $634,800 |
| 2022 | $5,349 | $984,600 | $323,100 | $661,500 |
| 2021 | $4,885 | $765,500 | $256,300 | $509,200 |
| 2020 | $4,995 | $738,600 | $256,300 | $482,300 |
| 2019 | $4,988 | $719,700 | $241,800 | $477,900 |
| 2016 | $3,998 | $557,800 | $217,900 | $339,900 |
Source: Public Records
Map
Nearby Homes
- 1891 Richard Rd
- 8642 S Cessna Cir
- 8638 Piper Ln
- 1924 E Viscounti Cove
- 1990 E Terra Vista Way
- 1579 E 8730 S
- 8483 Terrace Dr
- 8492 S Mesa Dr
- 8857 S Capella Way
- 8797 S Capella Way
- 1430 E 8685 S
- 1627 E Mulberry Way
- 8411 S 1475 E
- 1371 Sudbury Ave
- 1482 Waters Ln
- 2156 E Falcon Way
- 9078 S Daybreak Dr
- 2152 E Creek Rd
- 8081 Beaumont Dr
- 8266 S Creek Hollow Cove
- 8701 S Glider Ln
- 8691 S Glider Ln
- 8691 Glider Ln
- 8711 Glider Ln
- 8711 S Glider Ln
- 1867 E Summer Park Cir
- 1867 Summer Park Cir
- 1827 Glider Ln
- 1877 E Summer Park Cir
- 1877 Summer Park Cir
- 8704 Glider Ln
- 8704 S Glider Ln
- 8714 S Glider Ln
- 8714 Glider Ln
- 1818 E Glider Ln
- 1818 Glider Ln
- 1817 Glider Ln
- 1887 Summer Park Cir
- 8735 Glider Ln
- 1870 Summer Park Cir
Your Personal Tour Guide
Ask me questions while you tour the home.