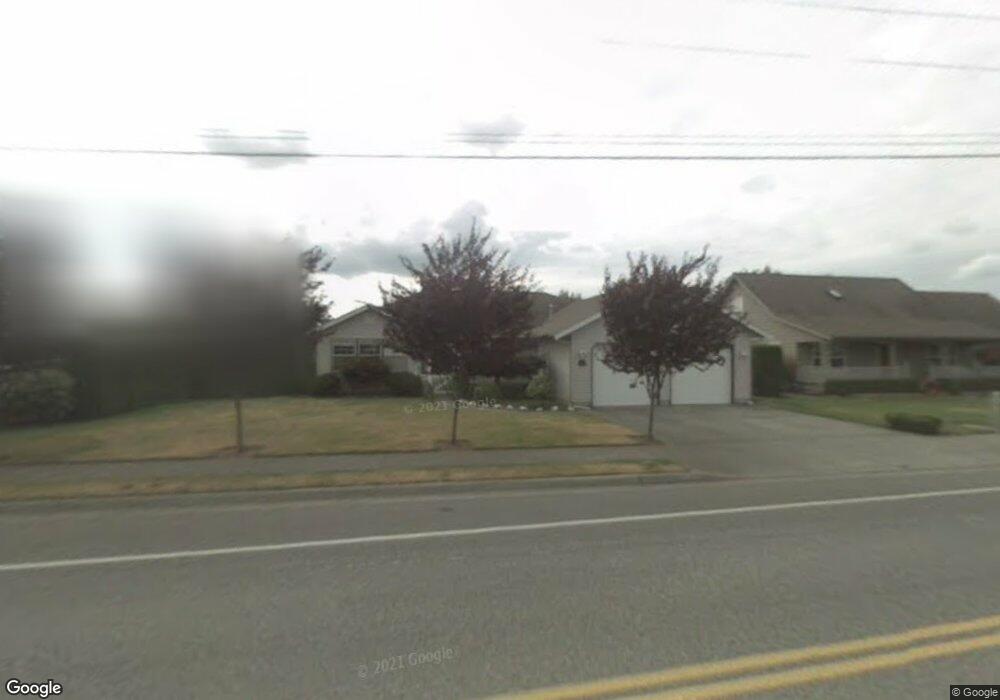
8703 Vinup Rd Lynden, WA 98264
Estimated Value: $612,516 - $661,000
3
Beds
2
Baths
1,866
Sq Ft
$339/Sq Ft
Est. Value
About This Home
This home is located at 8703 Vinup Rd, Lynden, WA 98264 and is currently estimated at $632,879, approximately $339 per square foot. 8703 Vinup Rd is a home located in Whatcom County with nearby schools including Lynden High School, Lynden Christian Schools: Administration, and Lynden Christian School.
Ownership History
Date
Name
Owned For
Owner Type
Purchase Details
Closed on
Apr 17, 2009
Sold by
Mouche Brian E and Mouche Annette
Bought by
Newcomb Timothy and Newcomb Helen
Current Estimated Value
Home Financials for this Owner
Home Financials are based on the most recent Mortgage that was taken out on this home.
Original Mortgage
$214,400
Outstanding Balance
$136,116
Interest Rate
5.02%
Mortgage Type
Purchase Money Mortgage
Estimated Equity
$496,763
Purchase Details
Closed on
Mar 17, 2003
Sold by
Kooiman Howard and Kooiman Grace
Bought by
Mouche Brian E and Mouche Annette
Home Financials for this Owner
Home Financials are based on the most recent Mortgage that was taken out on this home.
Original Mortgage
$197,760
Interest Rate
4%
Create a Home Valuation Report for This Property
The Home Valuation Report is an in-depth analysis detailing your home's value as well as a comparison with similar homes in the area
Home Values in the Area
Average Home Value in this Area
Purchase History
| Date | Buyer | Sale Price | Title Company |
|---|---|---|---|
| Newcomb Timothy | $268,280 | First American Title Ins | |
| Mouche Brian E | $192,000 | First American Title Insuran |
Source: Public Records
Mortgage History
| Date | Status | Borrower | Loan Amount |
|---|---|---|---|
| Open | Newcomb Timothy | $214,400 | |
| Previous Owner | Mouche Brian E | $197,760 |
Source: Public Records
Tax History Compared to Growth
Tax History
| Year | Tax Paid | Tax Assessment Tax Assessment Total Assessment is a certain percentage of the fair market value that is determined by local assessors to be the total taxable value of land and additions on the property. | Land | Improvement |
|---|---|---|---|---|
| 2024 | $4,214 | $594,399 | $218,250 | $376,149 |
| 2023 | $4,214 | $586,682 | $225,000 | $361,682 |
| 2022 | $3,559 | $467,446 | $153,434 | $314,012 |
| 2021 | $3,491 | $386,314 | $126,803 | $259,511 |
| 2020 | $3,058 | $344,932 | $113,220 | $231,712 |
| 2019 | $2,720 | $316,358 | $103,955 | $212,403 |
| 2018 | $2,973 | $288,506 | $94,699 | $193,807 |
| 2017 | $2,564 | $258,958 | $85,000 | $173,958 |
| 2016 | $2,419 | $237,552 | $70,400 | $167,152 |
| 2015 | $2,144 | $222,940 | $67,712 | $155,228 |
| 2014 | -- | $215,387 | $65,408 | $149,979 |
| 2013 | -- | $213,979 | $64,000 | $149,979 |
Source: Public Records
Map
Nearby Homes
- 1136 N Cascade Ct
- 1112 N Cascade Ct
- 1660 Eastwood Way
- 1251 Garden Cir
- 1319 Bradley Ct
- 1402 Bradley Meadows Ln
- 2201 Dejong Dr
- 2205 Dejong Dr
- 1178 E Grover St Unit 101
- 9586 Bender Rd
- 8639 Bender Rd
- 1725 Aaron Dr
- 8885 Line Rd
- 1095 Terrace Dr
- 2202 Berryman Loop
- 1792 Bradley Rd
- 924 E Grover St
- 137 E Cedar Dr
- 107 Springview Dr
- 114 Twin Sister Loop
- 8709 Vinup Rd
- 1197 Edgewater Ln
- 8704 Vinup Rd
- 1712 Bridgeview Ct
- 1185 Edgewater Ln
- 1700 Bridgeview Ct
- 1202 Turnberry Ct
- 8715 Vinup Rd
- 1173 Edgewater Ln
- 1724 Bridgeview Ct
- 1205 Turnberry Ct
- 1214 Turnberry Ct
- 1701 Bridgeview Ct
- 8721 Vinup Rd
- 1161 Edgewater Ln
- 8718 Vinup Rd
- 1713 Bridgeview Ct
- 1184 Edgewater Ln
- 1725 Bridgeview Ct