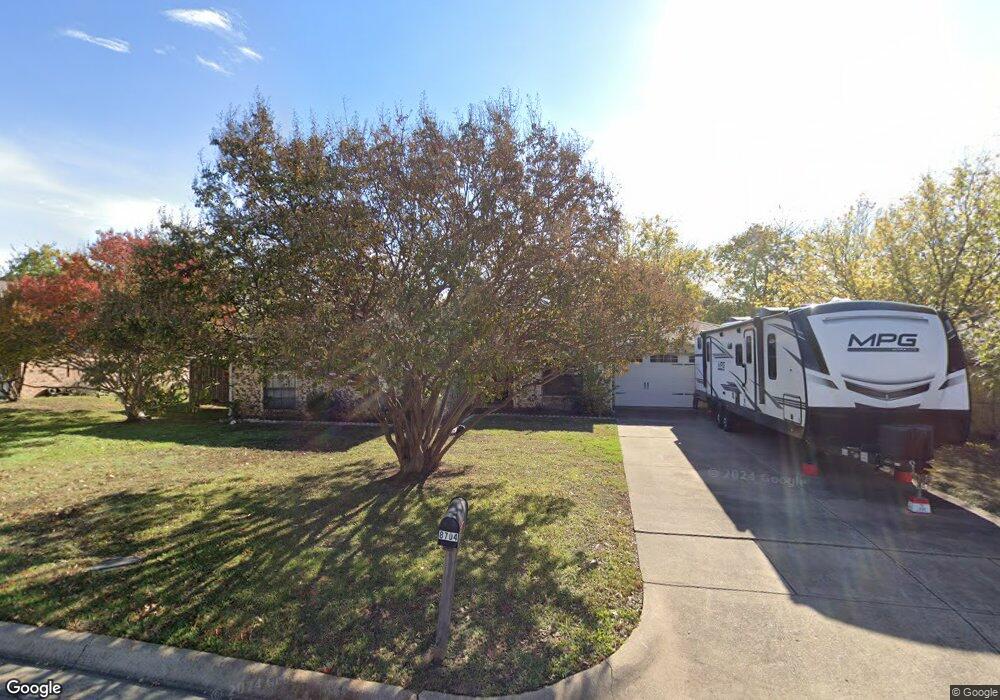
8704 Irongate Dr North Richland Hills, TX 76182
Estimated Value: $344,000 - $346,495
3
Beds
2
Baths
1,606
Sq Ft
$215/Sq Ft
Est. Value
About This Home
This home is located at 8704 Irongate Dr, North Richland Hills, TX 76182 and is currently estimated at $345,248, approximately $214 per square foot. 8704 Irongate Dr is a home located in Tarrant County with nearby schools including Walker Creek Elementary School, Smithfield Middle School, and Birdville High School.
Ownership History
Date
Name
Owned For
Owner Type
Purchase Details
Closed on
Sep 18, 2017
Sold by
Fontenot Frank David
Bought by
Fontenot Frank David and The Frank David Fontenot 2017 Revocable
Current Estimated Value
Purchase Details
Closed on
Aug 21, 2000
Sold by
Beadles Steven H and Beadles Mary A
Bought by
Parris Tony M
Home Financials for this Owner
Home Financials are based on the most recent Mortgage that was taken out on this home.
Original Mortgage
$92,952
Outstanding Balance
$33,537
Interest Rate
8.15%
Mortgage Type
FHA
Estimated Equity
$311,711
Purchase Details
Closed on
May 12, 1998
Sold by
Grady Maxine H
Bought by
Beadles Steven H and Beadles Mary A
Home Financials for this Owner
Home Financials are based on the most recent Mortgage that was taken out on this home.
Original Mortgage
$68,800
Interest Rate
7.18%
Create a Home Valuation Report for This Property
The Home Valuation Report is an in-depth analysis detailing your home's value as well as a comparison with similar homes in the area
Home Values in the Area
Average Home Value in this Area
Purchase History
| Date | Buyer | Sale Price | Title Company |
|---|---|---|---|
| Fontenot Frank David | -- | None Available | |
| Parris Tony M | -- | Allegiance Title Company | |
| Beadles Steven H | -- | Ticor Land Title Co |
Source: Public Records
Mortgage History
| Date | Status | Borrower | Loan Amount |
|---|---|---|---|
| Open | Parris Tony M | $92,952 | |
| Previous Owner | Beadles Steven H | $68,800 |
Source: Public Records
Tax History Compared to Growth
Tax History
| Year | Tax Paid | Tax Assessment Tax Assessment Total Assessment is a certain percentage of the fair market value that is determined by local assessors to be the total taxable value of land and additions on the property. | Land | Improvement |
|---|---|---|---|---|
| 2025 | $7,682 | $353,993 | $88,358 | $265,635 |
| 2024 | $7,682 | $353,993 | $88,358 | $265,635 |
| 2023 | $7,689 | $350,502 | $88,358 | $262,144 |
| 2022 | $7,147 | $296,992 | $40,000 | $256,992 |
| 2021 | $7,136 | $280,427 | $40,000 | $240,427 |
| 2020 | $5,840 | $229,510 | $40,000 | $189,510 |
| 2019 | $5,873 | $223,002 | $40,000 | $183,002 |
| 2018 | $5,145 | $195,379 | $40,000 | $155,379 |
| 2017 | $3,923 | $149,372 | $40,000 | $109,372 |
| 2016 | $3,566 | $152,530 | $17,000 | $135,530 |
| 2015 | $2,912 | $120,500 | $17,000 | $103,500 |
| 2014 | $2,912 | $120,500 | $17,000 | $103,500 |
Source: Public Records
Map
Nearby Homes
- 8436 Town Walk Dr
- 8420 Town Walk Dr
- 8421 Randy Dr
- 6509 Paula Ct
- 8409 Glenann Dr
- 8412 Glenann Dr
- 8409 Main St
- 6921 Westover Way
- 6625 Crane Rd
- 8440 Stephanie Dr
- 6432 Brynwyck Ln
- 8412 Timberline Ct
- 6505 Parkway Ave
- 8220 Odell St
- 8920 Martin Dr
- 6521 Rock Springs Dr
- 6704 Nob Hill Ct
- 6708 Nob Hill Ct
- 8740 Ice House Dr
- 6801 Woodland Hills Dr
- 8700 Irongate Dr
- 8708 Irongate Dr
- 6552 Riddle Dr
- 6548 Riddle Dr
- 8705 Irongate Dr
- 6544 Riddle Dr
- 8712 Irongate Dr
- 8709 Irongate Dr
- 8701 Irongate Dr
- 8713 Irongate Dr
- 6540 Riddle Dr
- 6529 Simmons Rd
- 8716 Irongate Dr
- 8704 Copper Canyon Rd
- 6525 Simmons Rd
- 8708 Copper Canyon Rd
- 8717 Irongate Dr
- 6536 Riddle Dr
- 6549 Riddle Dr
- 8700 Copper Canyon Rd