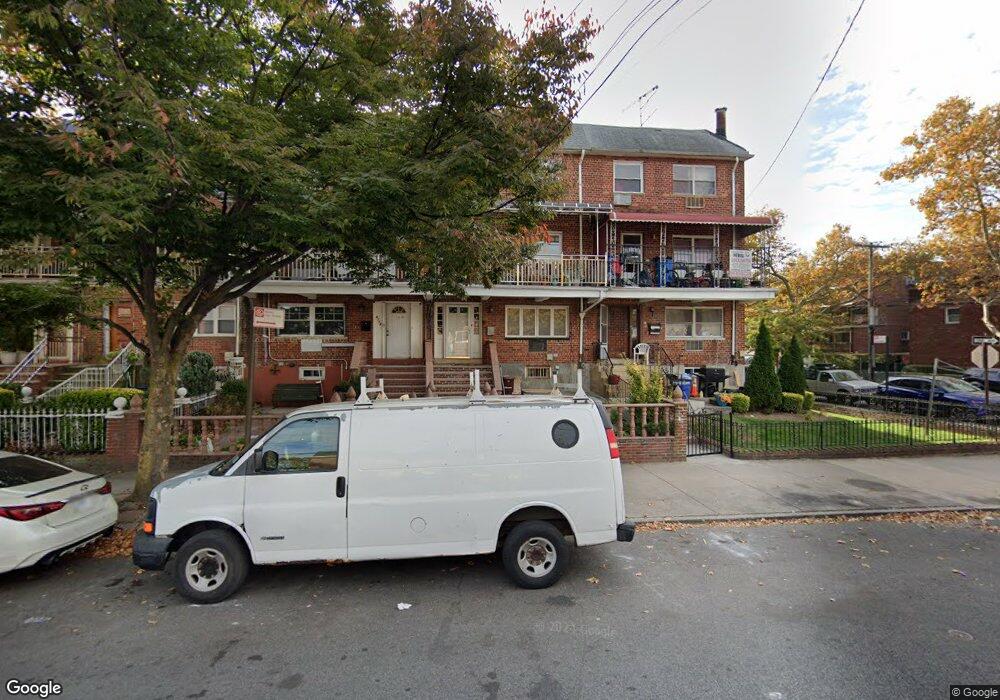
8706 Avenue N Brooklyn, NY 11236
Canarsie NeighborhoodEstimated Value: $823,000 - $1,134,000
--
Bed
--
Bath
2,760
Sq Ft
$343/Sq Ft
Est. Value
About This Home
This home is located at 8706 Avenue N, Brooklyn, NY 11236 and is currently estimated at $947,781, approximately $343 per square foot. 8706 Avenue N is a home located in Kings County with nearby schools including P.S. 115 Daniel Mucatel School, Is 68 Isaac Bildersee, and Our Lady Of Trust Catholic Accadamy.
Ownership History
Date
Name
Owned For
Owner Type
Purchase Details
Closed on
Nov 22, 2004
Sold by
Azikiwe Bosah
Bought by
Azikiwe Patrick
Current Estimated Value
Purchase Details
Closed on
Apr 28, 2003
Sold by
Asikwe Patrick
Bought by
Azikiwe Bosah
Home Financials for this Owner
Home Financials are based on the most recent Mortgage that was taken out on this home.
Original Mortgage
$345,100
Interest Rate
5.69%
Mortgage Type
Purchase Money Mortgage
Purchase Details
Closed on
Feb 12, 2001
Sold by
Eitz Chaim Foundation
Bought by
Asikwe Patrick
Home Financials for this Owner
Home Financials are based on the most recent Mortgage that was taken out on this home.
Original Mortgage
$285,500
Interest Rate
6.96%
Mortgage Type
FHA
Purchase Details
Closed on
Jun 20, 1997
Sold by
Scher Richard and Scher Joy
Bought by
Eitz Chaim Foundation
Create a Home Valuation Report for This Property
The Home Valuation Report is an in-depth analysis detailing your home's value as well as a comparison with similar homes in the area
Home Values in the Area
Average Home Value in this Area
Purchase History
| Date | Buyer | Sale Price | Title Company |
|---|---|---|---|
| Azikiwe Patrick | -- | -- | |
| Azikiwe Patrick | -- | -- | |
| Azikiwe Bosah | $435,000 | -- | |
| Azikiwe Bosah | $435,000 | -- | |
| Asikwe Patrick | -- | Madison Title Agency | |
| Asikwe Patrick | -- | Madison Title Agency | |
| Eitz Chaim Foundation | -- | -- | |
| Eitz Chaim Foundation | -- | -- |
Source: Public Records
Mortgage History
| Date | Status | Borrower | Loan Amount |
|---|---|---|---|
| Previous Owner | Azikiwe Bosah | $345,100 | |
| Previous Owner | Asikwe Patrick | $285,500 |
Source: Public Records
Tax History Compared to Growth
Tax History
| Year | Tax Paid | Tax Assessment Tax Assessment Total Assessment is a certain percentage of the fair market value that is determined by local assessors to be the total taxable value of land and additions on the property. | Land | Improvement |
|---|---|---|---|---|
| 2025 | $8,526 | $58,620 | $10,140 | $48,480 |
| 2024 | $8,526 | $60,780 | $10,140 | $50,640 |
| 2023 | $8,133 | $57,120 | $10,140 | $46,980 |
| 2022 | $7,542 | $46,140 | $10,140 | $36,000 |
| 2021 | $7,500 | $35,640 | $10,140 | $25,500 |
| 2020 | $4,007 | $40,620 | $10,140 | $30,480 |
| 2019 | $8,013 | $40,620 | $10,140 | $30,480 |
| 2018 | $7,634 | $37,450 | $9,093 | $28,357 |
| 2017 | $7,202 | $35,332 | $9,837 | $25,495 |
| 2016 | $6,764 | $33,835 | $8,054 | $25,781 |
| 2015 | $4,020 | $31,920 | $11,280 | $20,640 |
| 2014 | $4,020 | $31,920 | $11,280 | $20,640 |
Source: Public Records
Map
Nearby Homes
- 1414 E 89th St
- 1446 E 89th St
- 1440 E 86th St Unit 3
- 1442 E 86th St
- 1429 E 89th St
- 1345 E 86th St
- 1460 E 86th St
- 1646 Remsen Ave
- 1464 E 86th St Unit 3
- 1404 E 85th St
- 1319 E 86th St
- 8704 Avenue M
- 1562 E 91st St
- 1435 E 80th St
- 8913 Avenue M
- 1307 E 84th St Unit 3A
- 1307 E 84th St Unit 3B
- 1307 E 84th St Unit 3D
- 1307 E 84th St Unit 2B
- 1307 E 84th St Unit 3C