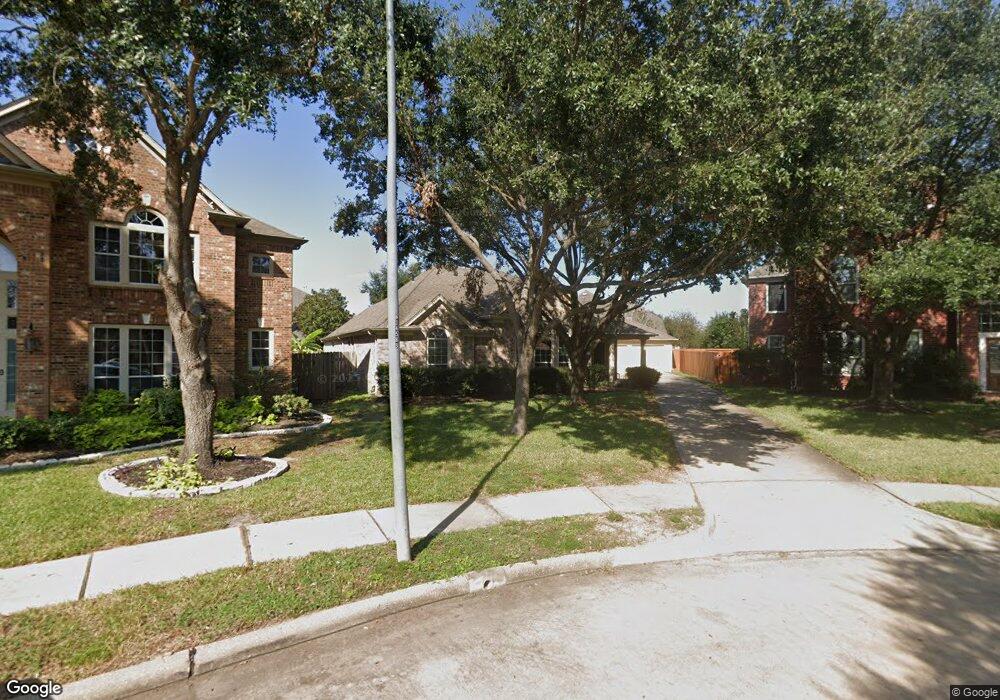
8706 Camden Row Ct Houston, TX 77095
Copperfield NeighborhoodEstimated Value: $432,000 - $471,000
5
Beds
4
Baths
4,111
Sq Ft
$109/Sq Ft
Est. Value
About This Home
This home is located at 8706 Camden Row Ct, Houston, TX 77095 and is currently estimated at $447,649, approximately $108 per square foot. 8706 Camden Row Ct is a home located in Harris County with nearby schools including Birkes Elementary School, Aragon Middle School, and Langham Creek High School.
Ownership History
Date
Name
Owned For
Owner Type
Purchase Details
Closed on
Dec 27, 2012
Sold by
Nationstar Mortgage Llc
Bought by
Singh Sampuran and Kaur Baldev
Current Estimated Value
Purchase Details
Closed on
Jul 26, 2012
Sold by
Aurora Bank Fsb
Bought by
Nationstar Mortgage Llc
Purchase Details
Closed on
Dec 7, 2005
Sold by
Pery Homes
Bought by
Sorrells Marc and Sorrells Karyn
Home Financials for this Owner
Home Financials are based on the most recent Mortgage that was taken out on this home.
Original Mortgage
$234,089
Interest Rate
6.29%
Mortgage Type
Fannie Mae Freddie Mac
Purchase Details
Closed on
Dec 6, 2005
Sold by
Scorrells Marc and Scorrells Karyn
Bought by
Aurora Bank Fsb
Home Financials for this Owner
Home Financials are based on the most recent Mortgage that was taken out on this home.
Original Mortgage
$234,089
Interest Rate
6.29%
Mortgage Type
Fannie Mae Freddie Mac
Create a Home Valuation Report for This Property
The Home Valuation Report is an in-depth analysis detailing your home's value as well as a comparison with similar homes in the area
Home Values in the Area
Average Home Value in this Area
Purchase History
| Date | Buyer | Sale Price | Title Company |
|---|---|---|---|
| Singh Sampuran | -- | None Available | |
| Nationstar Mortgage Llc | -- | None Available | |
| Sorrells Marc | -- | Chicago Title | |
| Aurora Bank Fsb | -- | None Available |
Source: Public Records
Mortgage History
| Date | Status | Borrower | Loan Amount |
|---|---|---|---|
| Previous Owner | Sorrells Marc | $234,089 |
Source: Public Records
Tax History Compared to Growth
Tax History
| Year | Tax Paid | Tax Assessment Tax Assessment Total Assessment is a certain percentage of the fair market value that is determined by local assessors to be the total taxable value of land and additions on the property. | Land | Improvement |
|---|---|---|---|---|
| 2025 | $2,448 | $473,958 | $74,075 | $399,883 |
| 2024 | $2,448 | $404,315 | $74,075 | $330,240 |
| 2023 | $2,448 | $487,317 | $74,075 | $413,242 |
| 2022 | $10,219 | $402,511 | $52,911 | $349,600 |
| 2021 | $9,842 | $351,369 | $52,911 | $298,458 |
| 2020 | $9,555 | $331,275 | $43,896 | $287,379 |
| 2019 | $9,357 | $315,510 | $40,761 | $274,749 |
| 2018 | $1,287 | $306,797 | $40,761 | $266,036 |
| 2017 | $9,131 | $306,797 | $40,761 | $266,036 |
| 2016 | $9,131 | $306,797 | $40,761 | $266,036 |
| 2015 | $8,097 | $303,395 | $40,761 | $262,634 |
| 2014 | $8,097 | $260,000 | $40,761 | $219,239 |
Source: Public Records
Map
Nearby Homes
- 8714 Ridgebury Cir
- 8855 Distant Woods Dr
- 16827 Newlight Bend Dr
- 16611 Gentle Stone Dr
- 9406 Morley Lake Dr
- 16511 Crystal View Ct
- 16602 Grenada Falls Dr
- 16606 Stoneside Dr
- 17215 Shallow Lake Ln
- 16514 Innisbrook Dr
- 16410 Dawnblush Ct
- 8411 Sandestine Ct
- 16426 Torry View Terrace
- 8619 Arranmore Ln
- 17038 Sperry Landing Dr
- 16839 Mammoth Springs Dr
- 8711 Preston Field Ln
- 16758 Mammoth Springs Dr
- 16403 Torry View Terrace
- 16827 Libson Falls Dr
- 8702 Camden Row Ct
- 8710 Camden Row Ct
- 8711 Ridgebury Cir
- 8715 Ridgebury Cir
- 8707 Ridgebury Cir
- 8703 Ridgebury Cir
- 8711 Camden Row Ct
- 8719 Ridgebury Cir
- 8707 Camden Row Ct
- 16839 Gentle Stone Dr
- 8703 Camden Row Ct
- 16831 Gentle Stone Dr
- 16835 Gentle Stone Dr
- 8859 Distant Woods Dr
- 8903 Distant Woods Dr
- 8723 Ridgebury Cir
- 16827 Gentle Stone Dr
- 8907 Distant Woods Dr
- 8851 Distant Woods Dr
- 16843 Gentle Stone Dr