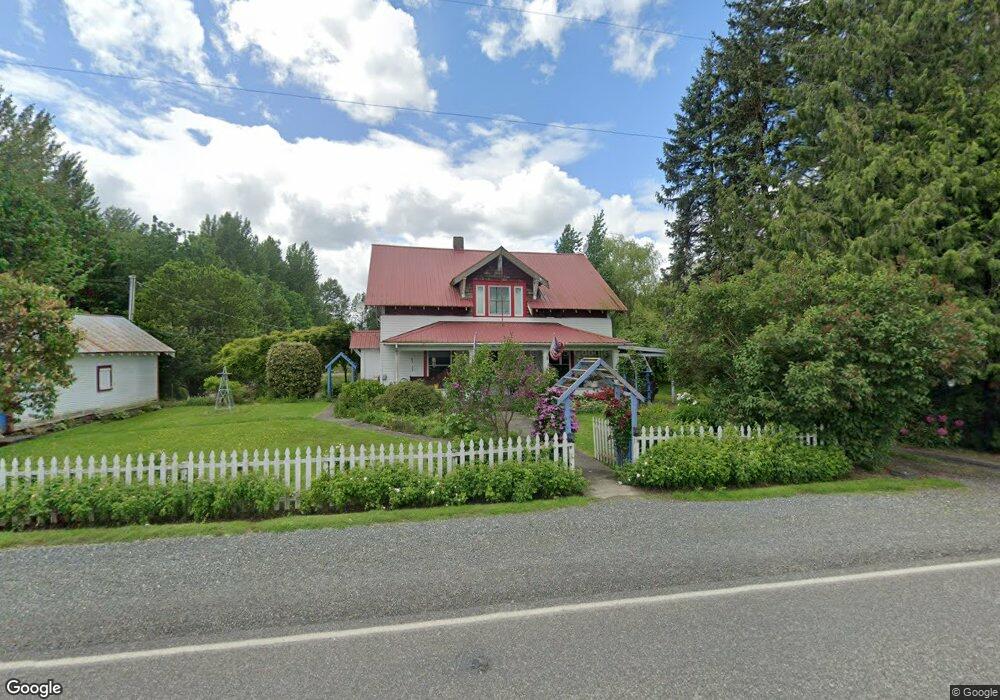
8707 Van Buren Rd Everson, WA 98247
Estimated Value: $1,198,000
4
Beds
1
Bath
1,828
Sq Ft
$655/Sq Ft
Est. Value
About This Home
This home is located at 8707 Van Buren Rd, Everson, WA 98247 and is currently estimated at $1,198,000, approximately $655 per square foot. 8707 Van Buren Rd is a home located in Whatcom County with nearby schools including Nooksack Elementary School, Everson Elementary School, and Sumas Elementary School.
Create a Home Valuation Report for This Property
The Home Valuation Report is an in-depth analysis detailing your home's value as well as a comparison with similar homes in the area
Tax History
| Year | Tax Paid | Tax Assessment Tax Assessment Total Assessment is a certain percentage of the fair market value that is determined by local assessors to be the total taxable value of land and additions on the property. | Land | Improvement |
|---|---|---|---|---|
| 2025 | $4,795 | $735,000 | $450,000 | $285,000 |
| 2024 | $3,031 | $816,018 | $516,175 | $299,843 |
| 2023 | $3,031 | $843,275 | $579,550 | $263,725 |
| 2022 | $2,705 | $759,720 | $522,126 | $237,594 |
| 2021 | $2,624 | $593,518 | $407,902 | $185,616 |
| 2020 | $2,315 | $187,462 | $30,160 | $157,302 |
| 2019 | $1,980 | $454,028 | $312,036 | $141,992 |
| 2018 | $2,757 | $161,605 | $26,000 | $135,605 |
| 2017 | $2,408 | $171,699 | $26,224 | $145,475 |
| 2016 | $2,401 | $152,974 | $23,364 | $129,610 |
| 2015 | $2,011 | $152,974 | $23,364 | $129,610 |
| 2014 | -- | $159,227 | $37,062 | $122,165 |
| 2013 | -- | $155,707 | $35,495 | $120,212 |
Source: Public Records
Map
Nearby Homes
- 303 Hayes St
- 705 E 6th St
- 407 E 2nd St
- 412 W 3rd St
- 512 Allison Way
- 404 W 3rd St
- 1915 Hampton Rd
- 702 N Washington St
- 308 W 3rd St
- 304 W 3rd St
- 416 W 4th St
- 409 W 4th St
- 209 Nooksack Ave
- 109 W 2nd St
- 107 Thendara Park Dr Unit C
- 408 W 3rd St
- 416 W 3rd St
- 108 Baker St Unit 1-4
- 207 E Main St
- 1925 Hampton Rd
- 8740 Van Buren Rd
- 8618 Van Buren Rd
- 8764 Van Buren Rd
- 8645 Van Buren Rd
- 8816 Van Buren Rd
- 8782 Van Buren Rd
- 2753 E Badger Rd
- 8573 Van Buren Rd
- 0 Van Buren Rd
- 2889 E Badger Rd
- 0 XX Van Buren Rd
- 2813 E Badger Rd
- 2748 E Badger Rd
- 2949 E Badger Rd
- 2882 E Badger Rd
- 8508 Van Buren Rd
- 2890 E Badger Rd
- 2105 Lindsay Rd
- 2952 E Badger Rd
Your Personal Tour Guide
Ask me questions while you tour the home.