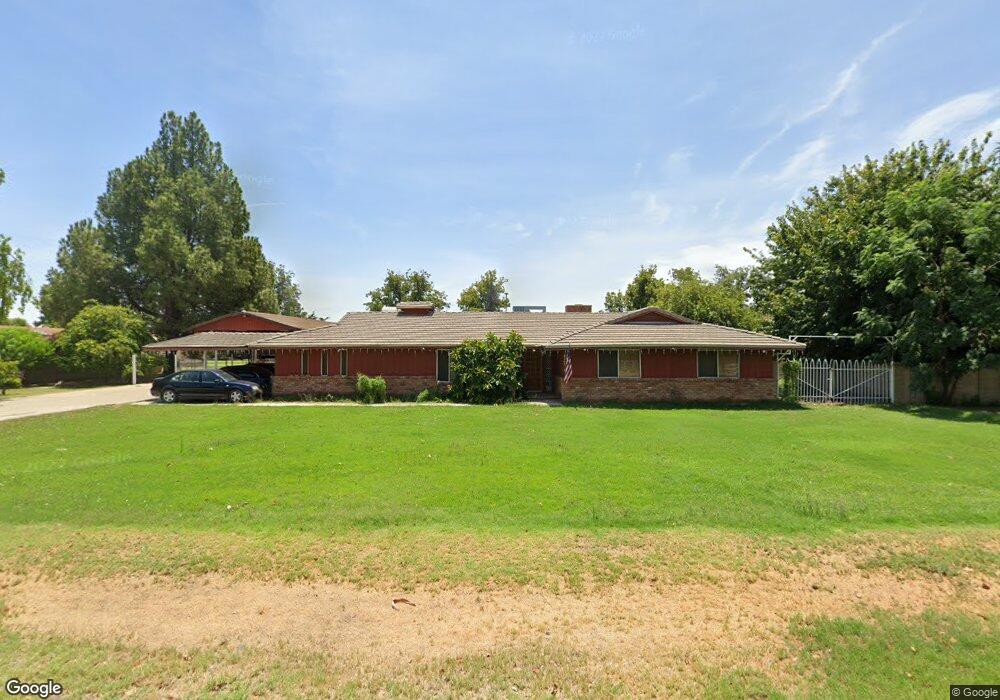
8707 W Lillian Ln Tolleson, AZ 85353
Estimated Value: $618,889 - $684,000
--
Bed
2
Baths
2,465
Sq Ft
$262/Sq Ft
Est. Value
About This Home
This home is located at 8707 W Lillian Ln, Tolleson, AZ 85353 and is currently estimated at $646,722, approximately $262 per square foot. 8707 W Lillian Ln is a home located in Maricopa County with nearby schools including Arizona Desert Elementary School and Tolleson Union High School.
Ownership History
Date
Name
Owned For
Owner Type
Purchase Details
Closed on
Nov 1, 2018
Sold by
Narramore Todd
Bought by
Jones Narramore Melody Kuulei and Jones Narramore Melody Kuulei
Current Estimated Value
Purchase Details
Closed on
Oct 17, 2018
Sold by
Jones Michael D and Jones Clayre E
Bought by
Jones Narramore Melody Kuulei and Jones Narramore Melody Kuulei
Purchase Details
Closed on
Apr 28, 2009
Sold by
Jones Clayre E
Bought by
Jones Clayre E and The Survivors Trust
Home Financials for this Owner
Home Financials are based on the most recent Mortgage that was taken out on this home.
Original Mortgage
$50,000
Interest Rate
4.99%
Mortgage Type
New Conventional
Purchase Details
Closed on
Feb 23, 2005
Sold by
Jones Clayre E and Jones Living Trust
Bought by
Jones Clayre E and Jones Living Trust
Purchase Details
Closed on
Nov 21, 1994
Sold by
Jones De N and Jones Clayre E
Bought by
Jones De N and Jones Clayre E
Create a Home Valuation Report for This Property
The Home Valuation Report is an in-depth analysis detailing your home's value as well as a comparison with similar homes in the area
Home Values in the Area
Average Home Value in this Area
Purchase History
| Date | Buyer | Sale Price | Title Company |
|---|---|---|---|
| Jones Narramore Melody Kuulei | -- | None Available | |
| Jones Narramore Melody Kuulei | -- | None Available | |
| Jones Clayre E | -- | None Available | |
| Jones Clayre E | -- | Lawyers Title Of Arizona Inc | |
| Jones Clayre E | -- | -- | |
| Jones De N | -- | -- | |
| Jones De N | -- | -- |
Source: Public Records
Mortgage History
| Date | Status | Borrower | Loan Amount |
|---|---|---|---|
| Previous Owner | Jones Clayre E | $50,000 |
Source: Public Records
Tax History Compared to Growth
Tax History
| Year | Tax Paid | Tax Assessment Tax Assessment Total Assessment is a certain percentage of the fair market value that is determined by local assessors to be the total taxable value of land and additions on the property. | Land | Improvement |
|---|---|---|---|---|
| 2025 | $3,676 | $26,134 | -- | -- |
| 2024 | $3,252 | $24,889 | -- | -- |
| 2023 | $3,252 | $59,820 | $11,960 | $47,860 |
| 2022 | $3,135 | $45,150 | $9,030 | $36,120 |
| 2021 | $3,016 | $39,060 | $7,810 | $31,250 |
| 2020 | $3,088 | $35,920 | $7,180 | $28,740 |
| 2019 | $3,110 | $31,020 | $6,200 | $24,820 |
| 2018 | $2,850 | $32,530 | $6,500 | $26,030 |
| 2017 | $2,588 | $27,080 | $5,410 | $21,670 |
| 2016 | $2,446 | $24,860 | $4,970 | $19,890 |
| 2015 | $2,404 | $20,650 | $4,130 | $16,520 |
Source: Public Records
Map
Nearby Homes
- 802 N Alzora Way
- 804 N Alzora Way
- 905 N Alzora Way
- 8606 W Van Buren St
- 9 N 87th Ln
- 5 N 87th Ln
- 8757 W Jefferson St
- 8905 W Jefferson St
- 9255 W Taylor St
- 9155 W Adams St
- 5 N 92nd Ave
- 0 S 91st Ave Unit 9 6913984
- 9310 W Van Buren St
- 8429 W Coronado Rd
- 8936 W Granada Rd
- 9024 W Granada Rd
- 8404 W Coronado Rd
- 8192 W Lynwood St Unit BLD55
- 1426 N 81st Dr Unit BLD45
- 8186 W Colcord Canyon Rd Unit BLD59
- 8801 W Lillian Ln
- 8705 W Lillian Ln
- 802 N Christa Way
- 8703 W Lillian Ln
- 8803 W Lillian Ln
- 801 N Alzora Way
- 8708 W C p Hayes Dr
- 8710 W C p Hayes Dr
- 804 N Christa Way
- 8706 W C p Hayes Dr
- 8701 W Lillian Ln
- 8712 W C p Hayes Dr
- 8805 W Lillian Ln
- 8704 W C p Hayes Dr
- 8704 W Charles P Hayes Dr
- 803 N Alzora Way
- 8714 W C p Hayes Dr
- 701 N Christa Way
- 801 N Christa Way
- 901 N Alzora Way