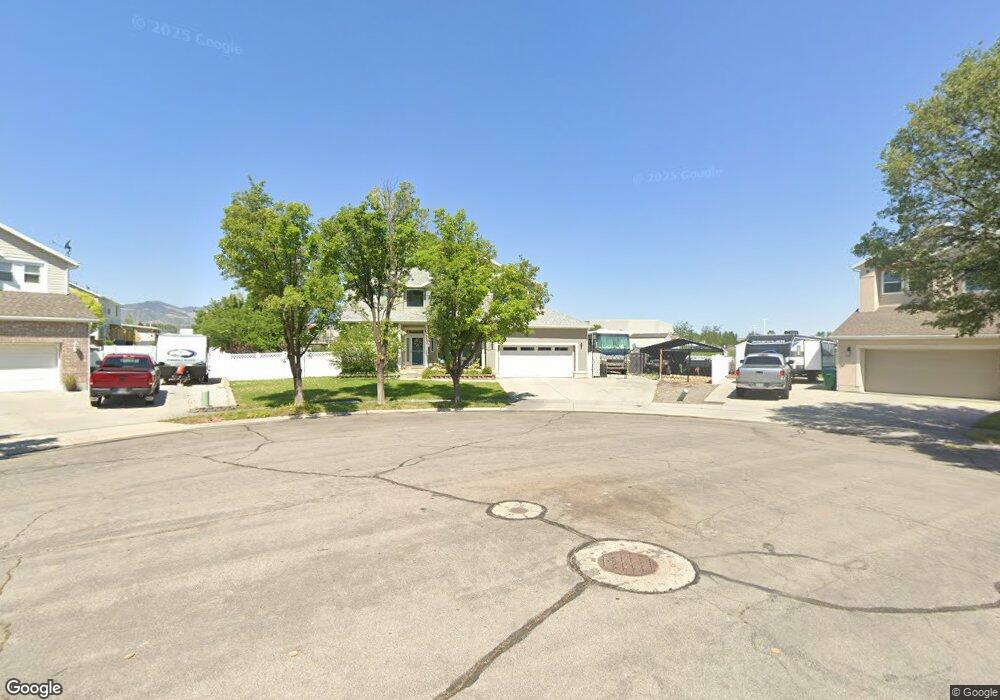
8708 Deep Creek Cir West Jordan, UT 84081
Copper Hills NeighborhoodEstimated Value: $676,000 - $705,000
5
Beds
3
Baths
3,783
Sq Ft
$181/Sq Ft
Est. Value
About This Home
This home is located at 8708 Deep Creek Cir, West Jordan, UT 84081 and is currently estimated at $684,480, approximately $180 per square foot. 8708 Deep Creek Cir is a home located in Salt Lake County with nearby schools including Copper Canyon School, West Hills Middle School, and Copper Hills High School.
Ownership History
Date
Name
Owned For
Owner Type
Purchase Details
Closed on
Oct 26, 2020
Sold by
Parslow Alana and Parslow Robert
Bought by
Parslow Robert and Parslow Alana
Current Estimated Value
Home Financials for this Owner
Home Financials are based on the most recent Mortgage that was taken out on this home.
Original Mortgage
$358,850
Outstanding Balance
$319,326
Interest Rate
2.8%
Mortgage Type
New Conventional
Estimated Equity
$365,154
Purchase Details
Closed on
Nov 26, 2012
Sold by
Parslow Alana
Bought by
Parslow Alana and Parslow Robert
Home Financials for this Owner
Home Financials are based on the most recent Mortgage that was taken out on this home.
Original Mortgage
$367,500
Interest Rate
3.33%
Mortgage Type
FHA
Purchase Details
Closed on
Dec 23, 2008
Sold by
Parslow Robert and Parslow Alana
Bought by
Parslow Alana
Home Financials for this Owner
Home Financials are based on the most recent Mortgage that was taken out on this home.
Original Mortgage
$367,137
Interest Rate
6.03%
Mortgage Type
FHA
Purchase Details
Closed on
Sep 19, 2008
Sold by
Parslow Alana
Bought by
Parslow Robert and Parslow Alana
Home Financials for this Owner
Home Financials are based on the most recent Mortgage that was taken out on this home.
Original Mortgage
$362,713
Interest Rate
6.51%
Mortgage Type
FHA
Purchase Details
Closed on
Mar 5, 2007
Sold by
Rip Daniel S
Bought by
Deep Creek Llc
Home Financials for this Owner
Home Financials are based on the most recent Mortgage that was taken out on this home.
Original Mortgage
$68,000
Interest Rate
6.29%
Mortgage Type
Stand Alone Second
Purchase Details
Closed on
Feb 28, 2007
Sold by
Sorensen Sr Jay D and Sorensen Lynette
Bought by
Rip Daniel S
Home Financials for this Owner
Home Financials are based on the most recent Mortgage that was taken out on this home.
Original Mortgage
$68,000
Interest Rate
6.29%
Mortgage Type
Stand Alone Second
Purchase Details
Closed on
Apr 19, 2004
Sold by
Sorensen Jay D
Bought by
Sorensen Sr Jay D and Sorensen Lynette
Home Financials for this Owner
Home Financials are based on the most recent Mortgage that was taken out on this home.
Original Mortgage
$252,000
Interest Rate
7.9%
Mortgage Type
New Conventional
Purchase Details
Closed on
Jun 30, 1995
Sold by
Ryland Group Inc
Bought by
Sorensen Sr Jay D and Sorensen Lynette
Home Financials for this Owner
Home Financials are based on the most recent Mortgage that was taken out on this home.
Original Mortgage
$157,350
Interest Rate
7.9%
Create a Home Valuation Report for This Property
The Home Valuation Report is an in-depth analysis detailing your home's value as well as a comparison with similar homes in the area
Home Values in the Area
Average Home Value in this Area
Purchase History
| Date | Buyer | Sale Price | Title Company |
|---|---|---|---|
| Parslow Robert | -- | Meridian Title | |
| Parslow Alana | -- | Nations Title Agency Of Utah | |
| Parslow Alana | -- | Guardian Title | |
| Parslow Robert | -- | Gt Title Services Slc | |
| Parslow Alana | -- | Gt Title Services Slc | |
| Deep Creek Llc | -- | Gt Title Service | |
| Rip Daniel S | -- | Bonneville Superior Title | |
| Sorensen Sr Jay D | -- | Wasatch Title Ins Agency Llc | |
| Sorensen Jay D | -- | Wasatch Title Ins Agency Llc | |
| Sorensen Sr Jay D | -- | -- |
Source: Public Records
Mortgage History
| Date | Status | Borrower | Loan Amount |
|---|---|---|---|
| Open | Parslow Robert | $358,850 | |
| Closed | Parslow Alana | $367,500 | |
| Closed | Parslow Alana | $367,137 | |
| Closed | Parslow Alana | $362,713 | |
| Previous Owner | Rip Daniel S | $68,000 | |
| Previous Owner | Rip Daniel S | $272,000 | |
| Previous Owner | Sorensen Jay D | $252,000 | |
| Previous Owner | Sorensen Sr Jay D | $35,000 | |
| Previous Owner | Sorensen Sr Jay D | $157,350 |
Source: Public Records
Tax History Compared to Growth
Tax History
| Year | Tax Paid | Tax Assessment Tax Assessment Total Assessment is a certain percentage of the fair market value that is determined by local assessors to be the total taxable value of land and additions on the property. | Land | Improvement |
|---|---|---|---|---|
| 2025 | $3,374 | $657,100 | $189,600 | $467,500 |
| 2024 | $3,374 | $649,200 | $187,700 | $461,500 |
| 2023 | $3,374 | $620,400 | $177,100 | $443,300 |
| 2022 | $3,242 | $578,300 | $173,600 | $404,700 |
| 2021 | $2,738 | $444,700 | $135,000 | $309,700 |
| 2020 | $2,545 | $387,800 | $135,000 | $252,800 |
| 2019 | $2,499 | $373,400 | $127,300 | $246,100 |
| 2018 | $2,356 | $349,300 | $127,300 | $222,000 |
| 2017 | $2,233 | $329,500 | $127,300 | $202,200 |
| 2016 | $2,174 | $301,500 | $127,300 | $174,200 |
| 2015 | $1,999 | $270,300 | $134,600 | $135,700 |
| 2014 | $1,831 | $243,700 | $123,700 | $120,000 |
Source: Public Records
Map
Nearby Homes
- 8854 Rocky Creek Dr
- 8577 Autumn Gold Cir
- 8767 S Brown Park Dr
- 8453 S Windmill Dr
- 5582 Washoe Cove
- 8441 S Spratling Dr
- 5098 Cherry Laurel Ln
- 9118 S Wisteria Way
- 4887 W 8620 S
- 9182 Wisteria Way
- 8322 Copper Vista Cir
- 7903 Mckenzie Ln
- 7886 Mckenzie Ln
- 5746 W Swift Creek Rd
- 5422 W Island Creek Dr
- 4904 Wild Acres Dr
- 4624 Pine Crossing Dr
- 9332 S Wild Clover Ln
- 5719 W Boulder Creek Rd
- 5946 W Eric Mountain Ln Unit 103
- 8702 Deep Creek Cir
- 8702 S Deep Creek Cir
- 8729 Mountain Pass Cir
- 8729 S Mountain Pass Cir
- 8737 Mountain Pass Cir
- 8737 S Mountain Pass Cir
- 8709 Deep Creek Cir
- 8734 Deep Creek Cir
- 8721 Deep Creek Cir
- 8735 Deep Creek Cir
- 8694 Mountain Vista Dr
- 8736 Mountain Pass Cir
- 8736 S Mountain Pass Cir
- 8746 Deep Creek Cir
- 8694 S Mountain Vista Dr
- 8747 S Mountain Pass Cir
- 8747 Mountain Pass Cir
- 8694 S Mountain Vista Dr
- 8708 S Mountain Vista Dr
- 8708 Mountain Vista Dr