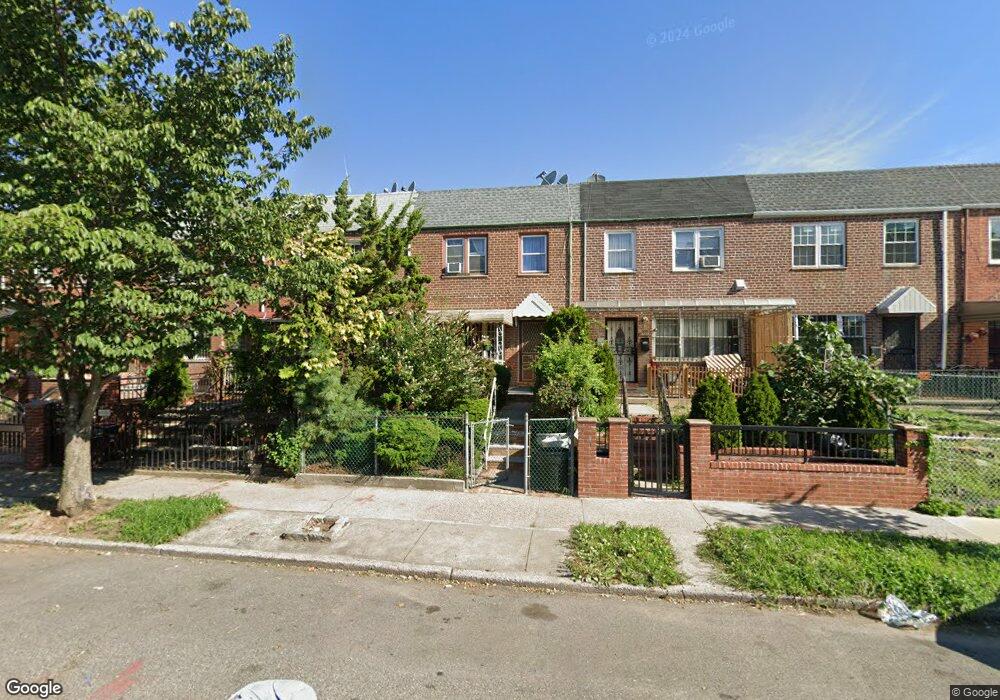
8709 30th Ave East Elmhurst, NY 11369
Jackson Heights NeighborhoodEstimated Value: $759,000 - $949,000
--
Bed
--
Bath
1,356
Sq Ft
$654/Sq Ft
Est. Value
About This Home
This home is located at 8709 30th Ave, East Elmhurst, NY 11369 and is currently estimated at $886,263, approximately $653 per square foot. 8709 30th Ave is a home located in Queens County with nearby schools including P.S. 148, I.S. 145 Joseph Pulitzer Magnet School, and Newtown High School.
Ownership History
Date
Name
Owned For
Owner Type
Purchase Details
Closed on
Nov 21, 2008
Sold by
Siegel Eugene D and Siegel Phyllis J
Bought by
Gomez Myriam and Rueda Juan D
Current Estimated Value
Home Financials for this Owner
Home Financials are based on the most recent Mortgage that was taken out on this home.
Original Mortgage
$376,000
Outstanding Balance
$247,181
Interest Rate
6.11%
Estimated Equity
$639,082
Create a Home Valuation Report for This Property
The Home Valuation Report is an in-depth analysis detailing your home's value as well as a comparison with similar homes in the area
Home Values in the Area
Average Home Value in this Area
Purchase History
| Date | Buyer | Sale Price | Title Company |
|---|---|---|---|
| Gomez Myriam | $470,000 | -- | |
| Gomez Myriam | $470,000 | -- |
Source: Public Records
Mortgage History
| Date | Status | Borrower | Loan Amount |
|---|---|---|---|
| Open | Gomez Myriam | $376,000 | |
| Closed | Gomez Myriam | $376,000 |
Source: Public Records
Tax History Compared to Growth
Tax History
| Year | Tax Paid | Tax Assessment Tax Assessment Total Assessment is a certain percentage of the fair market value that is determined by local assessors to be the total taxable value of land and additions on the property. | Land | Improvement |
|---|---|---|---|---|
| 2025 | $7,115 | $39,035 | $6,414 | $32,621 |
| 2024 | $7,397 | $36,826 | $6,227 | $30,599 |
| 2023 | $7,115 | $36,826 | $6,192 | $30,634 |
| 2022 | $7,009 | $56,580 | $9,060 | $47,520 |
| 2021 | $6,960 | $47,100 | $9,060 | $38,040 |
| 2020 | $6,589 | $43,980 | $9,060 | $34,920 |
| 2019 | $6,127 | $42,420 | $9,060 | $33,360 |
| 2018 | $5,958 | $30,688 | $6,270 | $24,418 |
| 2017 | $5,909 | $30,455 | $7,141 | $23,314 |
| 2016 | $5,434 | $30,455 | $7,141 | $23,314 |
| 2015 | $3,246 | $27,108 | $7,393 | $19,715 |
| 2014 | $3,246 | $25,574 | $7,472 | $18,102 |
Source: Public Records
Map
Nearby Homes