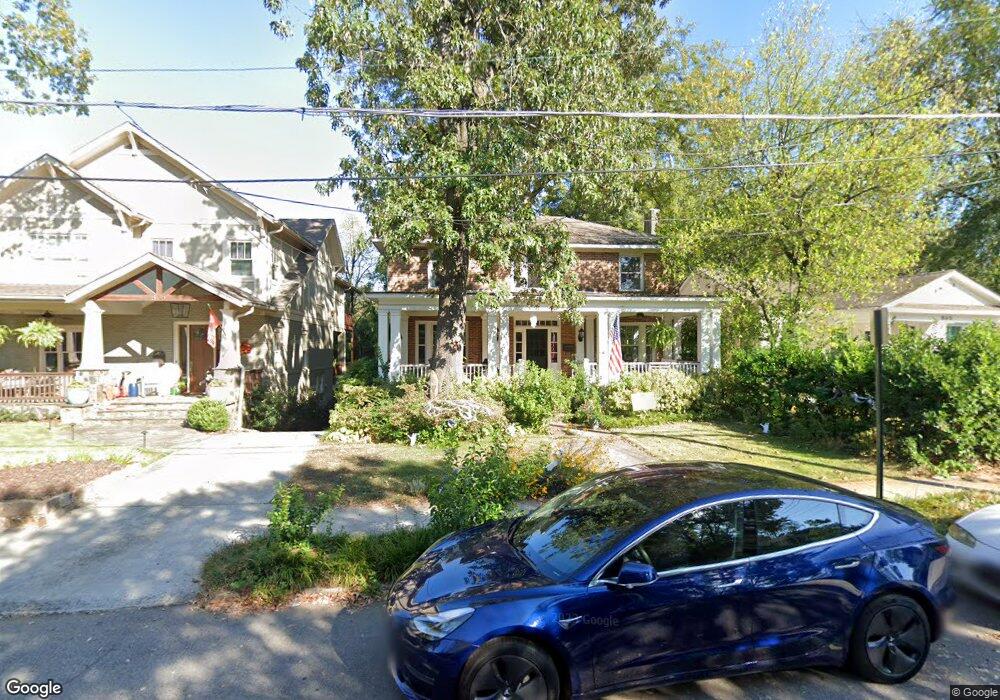
871 Arlington Place NE Atlanta, GA 30306
Virginia Highland NeighborhoodEstimated Value: $1,016,000 - $1,176,000
4
Beds
2
Baths
1,850
Sq Ft
$578/Sq Ft
Est. Value
About This Home
This home is located at 871 Arlington Place NE, Atlanta, GA 30306 and is currently estimated at $1,069,450, approximately $578 per square foot. 871 Arlington Place NE is a home located in Fulton County with nearby schools including Springdale Park Elementary School, Midtown High School, and Atlanta Montessori International School - Druid Hills.
Ownership History
Date
Name
Owned For
Owner Type
Purchase Details
Closed on
Aug 19, 2008
Sold by
Edwards Carrie L
Bought by
Thomas Kristina K
Current Estimated Value
Home Financials for this Owner
Home Financials are based on the most recent Mortgage that was taken out on this home.
Original Mortgage
$417,000
Outstanding Balance
$277,423
Interest Rate
6.61%
Mortgage Type
New Conventional
Estimated Equity
$792,027
Purchase Details
Closed on
Oct 10, 2005
Sold by
Noah Mark E and Noah Jennifer J
Bought by
Edwards Carrie L and Daffner Jason
Home Financials for this Owner
Home Financials are based on the most recent Mortgage that was taken out on this home.
Original Mortgage
$344,000
Interest Rate
5.66%
Mortgage Type
New Conventional
Purchase Details
Closed on
Feb 22, 2002
Sold by
Noah Jennifer J
Bought by
Noah Mark E and Noah Jennifer J
Purchase Details
Closed on
Oct 28, 1994
Sold by
Brown Johnny C
Bought by
Noah Mark Jennifer
Home Financials for this Owner
Home Financials are based on the most recent Mortgage that was taken out on this home.
Original Mortgage
$161,550
Interest Rate
8.82%
Create a Home Valuation Report for This Property
The Home Valuation Report is an in-depth analysis detailing your home's value as well as a comparison with similar homes in the area
Home Values in the Area
Average Home Value in this Area
Purchase History
| Date | Buyer | Sale Price | Title Company |
|---|---|---|---|
| Thomas Kristina K | $525,000 | -- | |
| Edwards Carrie L | $430,000 | -- | |
| Noah Mark E | -- | -- | |
| Noah Mark Jennifer | $179,500 | -- |
Source: Public Records
Mortgage History
| Date | Status | Borrower | Loan Amount |
|---|---|---|---|
| Open | Thomas Kristina K | $417,000 | |
| Previous Owner | Edwards Carrie L | $344,000 | |
| Previous Owner | Noah Mark Jennifer | $161,550 |
Source: Public Records
Tax History Compared to Growth
Tax History
| Year | Tax Paid | Tax Assessment Tax Assessment Total Assessment is a certain percentage of the fair market value that is determined by local assessors to be the total taxable value of land and additions on the property. | Land | Improvement |
|---|---|---|---|---|
| 2025 | $8,540 | $350,000 | $119,080 | $230,920 |
| 2023 | $15,990 | $350,000 | $119,080 | $230,920 |
| 2022 | $9,065 | $318,000 | $68,880 | $249,120 |
| 2021 | $8,996 | $318,000 | $68,880 | $249,120 |
| 2020 | $8,265 | $336,080 | $68,880 | $267,200 |
| 2019 | $485 | $294,080 | $66,520 | $227,560 |
| 2018 | $9,508 | $287,200 | $64,960 | $222,240 |
| 2017 | $7,911 | $226,600 | $31,720 | $194,880 |
| 2016 | $6,342 | $178,920 | $27,840 | $151,080 |
| 2015 | $8,396 | $178,920 | $27,840 | $151,080 |
| 2014 | $6,257 | $198,800 | $27,840 | $170,960 |
Source: Public Records
Map
Nearby Homes
- 908 N Highland Ave NE
- 1039 Greenwood Ave NE
- 1038 Saint Charles Ave NE
- 872 Briarcliff Rd NE Unit B2
- 866 Briarcliff Rd NE Unit D2
- 964 N Highland Ave NE
- 789 Frederica St NE Unit 1
- 878 Briarcliff Rd NE Unit B4
- 1200 Ponce de Leon Ave NE Unit A-19
- 741 Frederica St NE Unit 8
- 741 Frederica St NE Unit 9
- 741 Frederica St NE Unit 22
- 733 Frederica St NE Unit 7
- 733 Frederica St NE Unit 12
- 733 Frederica St NE Unit 2
- 869 Briarcliff Rd NE Unit 25
- 869 Briarcliff Rd NE Unit 11
- 885 Briarcliff Rd NE Unit D11
- 1210 Virginia Ct NE Unit 5
- 875 Arlington Place NE
- 865 Arlington Place NE
- 879 Arlington Place NE
- 861 Arlington Place NE
- 855 Arlington Place NE
- 885 Arlington Place NE
- 889 Arlington Place NE
- 851 Arlington Place NE
- 0 Arlington Place NE Unit 7049788
- 0 Arlington Place NE Unit 3174911
- 0 Arlington Place NE Unit 8786623
- 0 Arlington Place NE Unit 7579584
- 0 Arlington Place NE Unit 3076393
- 0 Arlington Place NE Unit 2775030
- 0 Arlington Place NE
- 872 Arlington Place NE
- 866 Arlington Place NE
- 876 Arlington Place NE
- 862 Arlington Place NE
- 880 Arlington Place NE