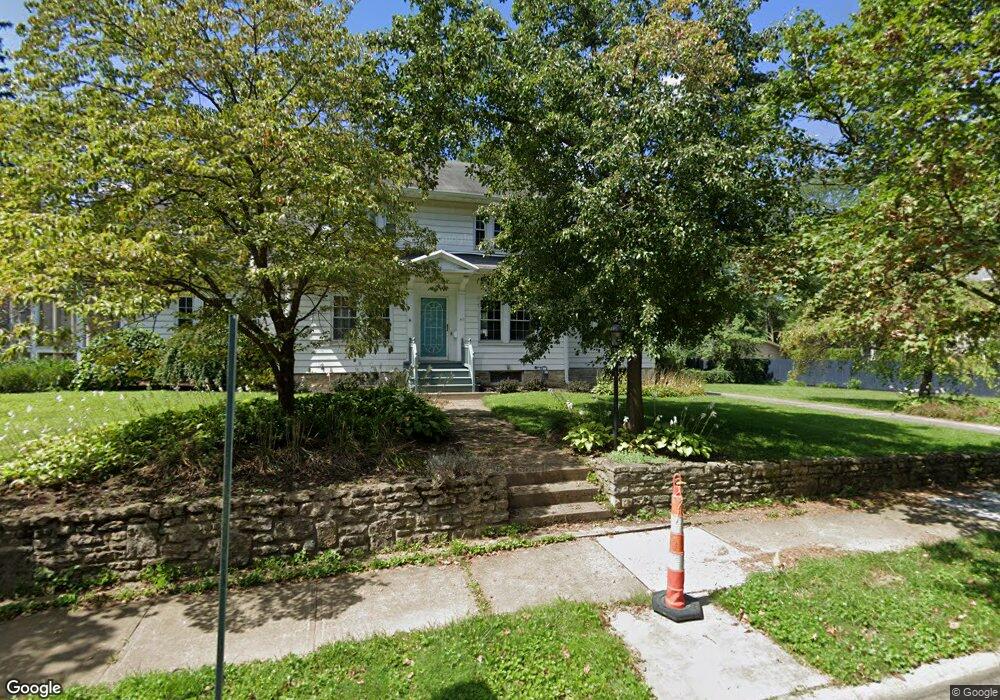
871 Euclaire Ave Columbus, OH 43209
Estimated Value: $614,000 - $998,000
4
Beds
3
Baths
2,992
Sq Ft
$265/Sq Ft
Est. Value
About This Home
This home is located at 871 Euclaire Ave, Columbus, OH 43209 and is currently estimated at $791,940, approximately $264 per square foot. 871 Euclaire Ave is a home located in Franklin County with nearby schools including Montrose Elementary School, Bexley Middle School, and Bexley High School.
Ownership History
Date
Name
Owned For
Owner Type
Purchase Details
Closed on
Jul 18, 2013
Sold by
Liefeld Mark S and Reed Liefeld Rebecca H
Bought by
Johnson Adam B and Allain Dawn C
Current Estimated Value
Home Financials for this Owner
Home Financials are based on the most recent Mortgage that was taken out on this home.
Original Mortgage
$384,750
Outstanding Balance
$279,888
Interest Rate
3.93%
Mortgage Type
New Conventional
Estimated Equity
$512,052
Purchase Details
Closed on
Sep 3, 1996
Sold by
Loeb Charles A
Bought by
Mark S Liefeld and Mark Rebeccah Reed
Home Financials for this Owner
Home Financials are based on the most recent Mortgage that was taken out on this home.
Original Mortgage
$228,000
Interest Rate
8%
Mortgage Type
New Conventional
Purchase Details
Closed on
Jul 23, 1992
Create a Home Valuation Report for This Property
The Home Valuation Report is an in-depth analysis detailing your home's value as well as a comparison with similar homes in the area
Home Values in the Area
Average Home Value in this Area
Purchase History
| Date | Buyer | Sale Price | Title Company |
|---|---|---|---|
| Johnson Adam B | $90,000 | Hummel Title Agency | |
| Johnson Adam B | $405,000 | Hummel Title Agency | |
| Mark S Liefeld | $285,000 | -- | |
| -- | -- | -- |
Source: Public Records
Mortgage History
| Date | Status | Borrower | Loan Amount |
|---|---|---|---|
| Open | Johnson Adam B | $384,750 | |
| Closed | Johnson Adam B | $58,500 | |
| Previous Owner | Mark S Liefeld | $228,000 |
Source: Public Records
Tax History Compared to Growth
Tax History
| Year | Tax Paid | Tax Assessment Tax Assessment Total Assessment is a certain percentage of the fair market value that is determined by local assessors to be the total taxable value of land and additions on the property. | Land | Improvement |
|---|---|---|---|---|
| 2024 | $10,950 | $197,190 | $72,590 | $124,600 |
| 2023 | $9,845 | $197,190 | $72,590 | $124,600 |
| 2022 | $12,207 | $196,350 | $52,430 | $143,920 |
| 2021 | $12,216 | $196,350 | $52,430 | $143,920 |
| 2020 | $12,109 | $196,350 | $52,430 | $143,920 |
| 2019 | $11,427 | $163,030 | $43,680 | $119,350 |
| 2018 | $10,172 | $163,030 | $43,680 | $119,350 |
| 2017 | $9,651 | $163,030 | $43,680 | $119,350 |
| 2016 | $9,612 | $147,780 | $41,550 | $106,230 |
| 2015 | $9,641 | $147,780 | $41,550 | $106,230 |
| 2014 | $9,695 | $147,780 | $41,550 | $106,230 |
| 2013 | $4,798 | $140,700 | $39,550 | $101,150 |
Source: Public Records
Map
Nearby Homes
- 945 Francis Ave
- 905 Vernon Rd
- 891 Vernon Rd
- 866-868 Sheridan Ave
- 782 S Remington Rd
- 895 Grandon Ave
- 1052 S Roosevelt Ave
- 696 Vernon Rd
- 563 S Dawson Ave
- 2424 Sherwood Rd
- 789 Chelsea Ave
- 2425 Bryden Rd
- 843 Kenwick Rd
- 2564 Sherwood Rd
- 811 S Chesterfield Rd
- 2530 Berwick Blvd
- 849 Lyman Ave
- 2676 Tudor Rd
- 1205 Kenwick Rd
- 723-725 S Chesterfield Rd
- 870 Euclaire Ave
- 853 Euclaire Ave
- 2400 N Havenwood Dr
- 847 Euclaire Ave
- 893 Euclaire Ave
- 862 Francis Ave
- 870 Francis Ave
- 854 Francis Ave
- 2406 Havenwood Dr N
- 2406 N Havenwood Dr
- 876 Francis Ave
- 843 Euclaire Ave
- 848 Francis Ave
- 854 Euclaire Ave
- 901 Euclaire Ave
- 882 Francis Ave
- 850 Euclaire Ave
- 2412 N Havenwood Dr
- 839 Euclaire Ave
- 840 Francis Ave