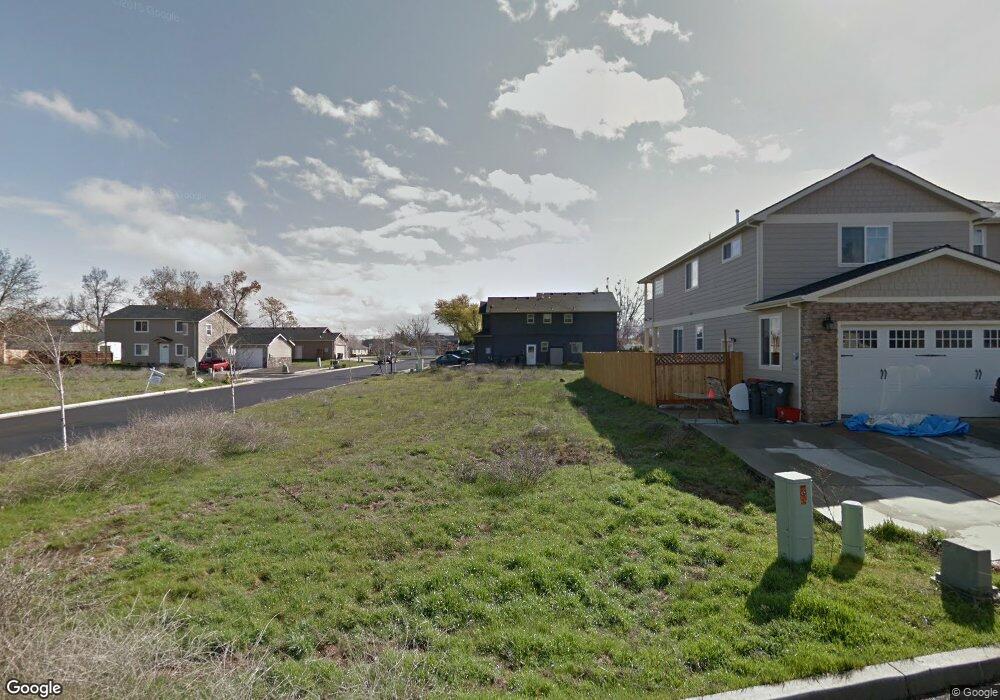
871 Holley Ln Central Point, OR 97502
Estimated Value: $544,000 - $552,000
2
Beds
3
Baths
2,543
Sq Ft
$216/Sq Ft
Est. Value
About This Home
This home is located at 871 Holley Ln, Central Point, OR 97502 and is currently estimated at $548,138, approximately $215 per square foot. 871 Holley Ln is a home located in Jackson County with nearby schools including Richardson Elementary School, Scenic Middle School, and Crater High School.
Ownership History
Date
Name
Owned For
Owner Type
Purchase Details
Closed on
Dec 13, 2017
Sold by
Harris Stephen and Harris Laura
Bought by
Cartwright Andrew J
Current Estimated Value
Home Financials for this Owner
Home Financials are based on the most recent Mortgage that was taken out on this home.
Original Mortgage
$274,850
Outstanding Balance
$148,431
Interest Rate
3.94%
Mortgage Type
New Conventional
Estimated Equity
$399,707
Purchase Details
Closed on
Dec 11, 2017
Sold by
Harris Stephen and Harris Laura
Bought by
Cartwright Andrew J
Home Financials for this Owner
Home Financials are based on the most recent Mortgage that was taken out on this home.
Original Mortgage
$274,850
Outstanding Balance
$148,431
Interest Rate
3.94%
Mortgage Type
New Conventional
Estimated Equity
$399,707
Purchase Details
Closed on
Mar 20, 2017
Sold by
Ames Custom Construction Inc
Bought by
Harruis Stephen and Harris Laura
Purchase Details
Closed on
Feb 26, 2015
Sold by
Jantzer & Sons Logging Inc 401K Profit S
Bought by
Carleton Family Trust
Purchase Details
Closed on
Mar 30, 2010
Sold by
Heritage Development Corporation
Bought by
Jantzer & Sons Logging Inc 401K Profit S
Create a Home Valuation Report for This Property
The Home Valuation Report is an in-depth analysis detailing your home's value as well as a comparison with similar homes in the area
Purchase History
| Date | Buyer | Sale Price | Title Company |
|---|---|---|---|
| Cartwright Andrew J | -- | First American Title | |
| Cartwright Andrew J | -- | First American Title | |
| Cartwright Andrew J | $370,000 | First American Title | |
| Cartwright Andrew J | $370,000 | First American Title | |
| Harruis Stephen | $349,000 | First American | |
| Harruis Stephen | $349,000 | First American | |
| Carleton Family Trust | $129,000 | First American | |
| Carleton Family Trust | $129,000 | First American | |
| Jantzer & Sons Logging Inc 401K Profit S | $348,549 | Fa | |
| Jantzer & Sons Logging Inc 401K Profit S | $348,549 | Fa |
Source: Public Records
Mortgage History
| Date | Status | Borrower | Loan Amount |
|---|---|---|---|
| Open | Cartwright Andrew J | $274,850 | |
| Closed | Cartwright Andrew J | $274,850 |
Source: Public Records
Tax History
| Year | Tax Paid | Tax Assessment Tax Assessment Total Assessment is a certain percentage of the fair market value that is determined by local assessors to be the total taxable value of land and additions on the property. | Land | Improvement |
|---|---|---|---|---|
| 2026 | $6,477 | $391,380 | -- | -- |
| 2025 | $6,318 | $379,990 | $100,770 | $279,220 |
| 2024 | $6,318 | $368,930 | $97,830 | $271,100 |
| 2023 | $6,114 | $358,190 | $94,980 | $263,210 |
| 2022 | $5,972 | $358,190 | $94,980 | $263,210 |
| 2021 | $5,801 | $347,760 | $92,210 | $255,550 |
| 2020 | $5,632 | $337,640 | $89,530 | $248,110 |
| 2019 | $5,493 | $318,270 | $84,390 | $233,880 |
| 2018 | $5,326 | $357,320 | $84,580 | $272,740 |
| 2017 | $2,455 | $357,320 | $84,580 | $272,740 |
| 2016 | $864 | $52,500 | $52,500 | $0 |
| 2015 | $775 | $47,330 | $47,330 | $0 |
| 2014 | $733 | $44,630 | $44,630 | $0 |
Source: Public Records
Map
Nearby Homes
- 871 Holley Way
- 895 Holley Way
- 209 Corcoran Ln
- 436 Cheney Loop
- 1189 Lindsey Ct
- 827 Isherwood Dr
- 349 W Pine St
- 185 Logan Ave
- 3288 Grant Rd
- 166 Nadine Ln
- 887 Silver Fox Dr
- 114 Cedar St
- 884 Mendolia Way
- 420 Mayberry Ln
- 755 S 4th St
- 220 S 3rd St
- 350 Alder St
- 404 Silver Creek Dr
- 407 Silver Creek Dr
- 3600 N Pacific Hwy
- 871 Holley Way Unit 4
- 872 Virginia Dr
- 872 Virginia Dr Unit 13
- 880 Virginia Dr
- 863 Virginia Dr
- 864 Virginia Dr
- 864 Virginia Dr Unit 12
- 0 Virginia Dr
- 887 Holley Way
- 855 Virginia Dr
- 856 Holley Way
- 148 Thomas Ct
- 876 Holley Way
- 866 Holley Way
- 866 Holley Way Unit 17
- 884 Holley Way
- 848 Virginia Dr Unit 10
- 848 Virginia Dr
- 136 Thomas Ct
- 3303 Snowy Butte Ln
Your Personal Tour Guide
Ask me questions while you tour the home.