Estimated Value: $310,000 - $338,000
3
Beds
2
Baths
2,006
Sq Ft
$161/Sq Ft
Est. Value
About This Home
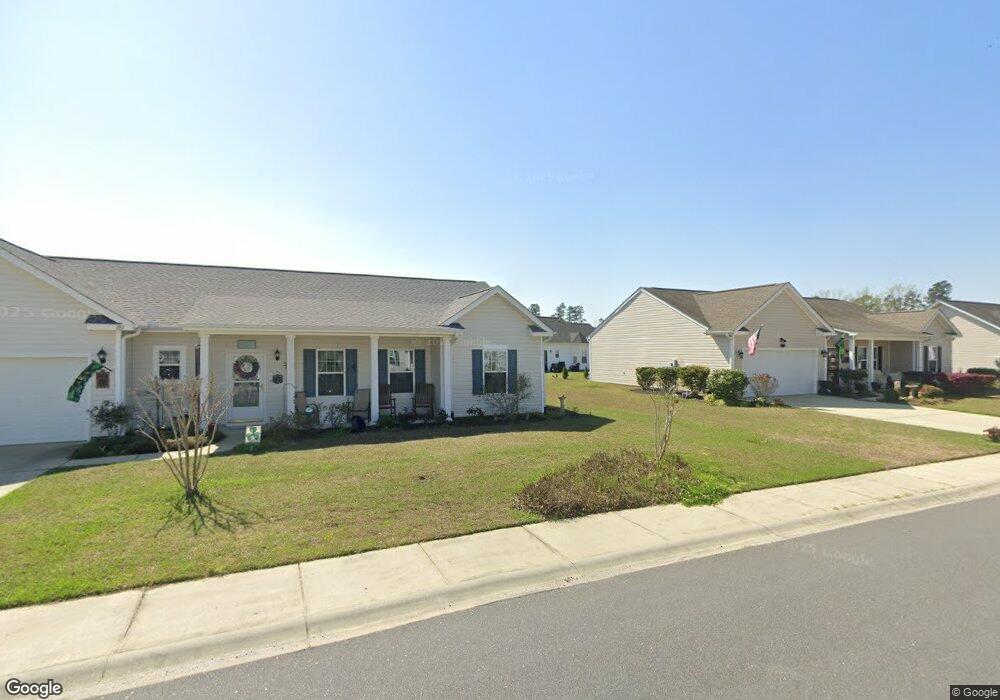
This home is located at 871 Inglenook Ln Unit Lot 146 @ Myrtle L, Longs, SC 29568 and is currently estimated at $322,122, approximately $160 per square foot. 871 Inglenook Ln Unit Lot 146 @ Myrtle L is a home located in Horry County with nearby schools including Daisy Elementary School, Loris Middle School, and Loris High School.
Ownership History
Date
Name
Owned For
Owner Type
Purchase Details
Closed on
Sep 5, 2024
Sold by
Phelps Charles W
Bought by
Martin Olivia Jo and Martin Lucas M
Current Estimated Value
Home Financials for this Owner
Home Financials are based on the most recent Mortgage that was taken out on this home.
Original Mortgage
$300,700
Outstanding Balance
$297,320
Interest Rate
6.47%
Mortgage Type
New Conventional
Estimated Equity
$24,802
Purchase Details
Closed on
Dec 3, 2019
Sold by
Clauson James J
Bought by
Phelps Charles W and Phelps Wanda L
Home Financials for this Owner
Home Financials are based on the most recent Mortgage that was taken out on this home.
Original Mortgage
$142,000
Interest Rate
3.6%
Mortgage Type
New Conventional
Purchase Details
Closed on
Aug 3, 2012
Sold by
Rsp Builders
Bought by
Clauson James J
Purchase Details
Closed on
Dec 27, 2010
Sold by
Crescent Bank
Bought by
Rsp Builders
Create a Home Valuation Report for This Property
The Home Valuation Report is an in-depth analysis detailing your home's value as well as a comparison with similar homes in the area
Home Values in the Area
Average Home Value in this Area
Purchase History
| Date | Buyer | Sale Price | Title Company |
|---|---|---|---|
| Martin Olivia Jo | $310,000 | -- | |
| Phelps Charles W | $186,000 | -- | |
| Clauson James J | $164,000 | -- | |
| Rsp Builders | $28,000 | -- |
Source: Public Records
Mortgage History
| Date | Status | Borrower | Loan Amount |
|---|---|---|---|
| Open | Martin Olivia Jo | $300,700 | |
| Previous Owner | Phelps Charles W | $142,000 |
Source: Public Records
Tax History Compared to Growth
Tax History
| Year | Tax Paid | Tax Assessment Tax Assessment Total Assessment is a certain percentage of the fair market value that is determined by local assessors to be the total taxable value of land and additions on the property. | Land | Improvement |
|---|---|---|---|---|
| 2024 | $677 | $12,171 | $3,031 | $9,140 |
| 2023 | $677 | $7,352 | $1,524 | $5,828 |
| 2021 | $590 | $7,352 | $1,524 | $5,828 |
| 2020 | $684 | $7,352 | $1,524 | $5,828 |
| 2019 | $568 | $8,152 | $1,524 | $6,628 |
| 2018 | $489 | $7,033 | $1,169 | $5,864 |
| 2017 | $474 | $7,033 | $1,169 | $5,864 |
| 2016 | -- | $7,033 | $1,169 | $5,864 |
| 2015 | $474 | $7,034 | $1,170 | $5,864 |
| 2014 | $437 | $7,034 | $1,170 | $5,864 |
Source: Public Records
Map
Nearby Homes
- 335 Oak Crest Cir
- 509 Sheepbridge Way
- 520 Sheepbridge Way
- 512 Sheepbridge Way
- 500 Sheepbridge Way
- 840 Big Cedar Dr
- 111 Oak Crest Cir
- 836 Big Cedar Dr
- 844 Big Cedar Dr
- 820 Big Cedar Dr
- 848 Big Cedar Dr
- 808 Big Cedar Dr
- 823 Big Cedar Dr
- 835 Big Cedar Dr
- 847 Big Cedar Dr
- 811 Big Cedar Dr
- 544 Sheepbridge Way
- 434 Oak Crest Cir
- 540 Sheepbridge Way
- 509 Sheepbridge Way
- 871 Inglenook Ln
- 871 Inglenook Ln Unit 146- MLN
- 867 Inglenook Ln
- 867 Inglenook Ln Unit Lot 145 @ Myrtle L
- 225 Oak Crest Cir Unit MLN 105
- 225 Oak Crest Cir
- 872 Inglenook Ln
- 872 Inglenook Ln Unit Lot 147 @ Myrtle L
- 229 Oak Crest Cir Unit MLN 106
- 229 Oak Crest Cir
- 293 Oak Crest Cir Unit MYRTLE LAKES NORTH L
- 293 Oak Crest Cir Unit MLN 117
- 293 Oak Crest Cir
- 293 Oak Crest Cir Unit Lot 117
- 297 Oak Crest Cir
- 297 Oak Crest Cir Unit Lot 118@ Myrtle La
- 221 Oak Crest Cir Unit MLN 104
- TBB 3 Oak Crest Cir Unit MLN TBB 3
- TBB 2 Oak Crest Cir Unit MLN TBB 2
- 287 Oak Crest Cir