Estimated Value: $134,000 - $170,000
2
Beds
1
Bath
768
Sq Ft
$199/Sq Ft
Est. Value
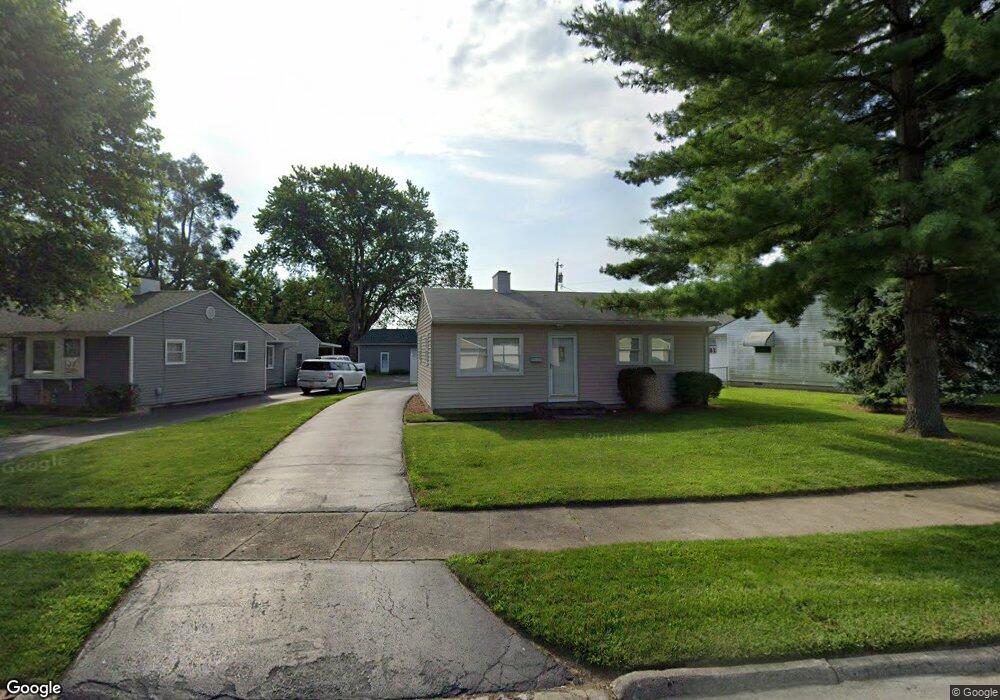
About This Home
This home is located at 871 June Dr, Xenia, OH 45385 and is currently estimated at $152,910, approximately $199 per square foot. 871 June Dr is a home located in Greene County with nearby schools including Xenia High School, Summit Academy Community School for Alternative Learners - Xenia, and Legacy Christian Academy.
Ownership History
Date
Name
Owned For
Owner Type
Purchase Details
Closed on
Oct 31, 2002
Sold by
Shoup Terry Lynn
Bought by
Shoup Thomas E
Current Estimated Value
Home Financials for this Owner
Home Financials are based on the most recent Mortgage that was taken out on this home.
Original Mortgage
$67,000
Outstanding Balance
$28,393
Interest Rate
6.18%
Estimated Equity
$124,517
Purchase Details
Closed on
May 3, 1995
Sold by
Reynolds Sherry
Bought by
Shoup Terry L
Home Financials for this Owner
Home Financials are based on the most recent Mortgage that was taken out on this home.
Original Mortgage
$56,000
Interest Rate
8.43%
Mortgage Type
New Conventional
Create a Home Valuation Report for This Property
The Home Valuation Report is an in-depth analysis detailing your home's value as well as a comparison with similar homes in the area
Home Values in the Area
Average Home Value in this Area
Purchase History
| Date | Buyer | Sale Price | Title Company |
|---|---|---|---|
| Shoup Thomas E | $67,000 | -- | |
| Shoup Terry L | $54,900 | -- |
Source: Public Records
Mortgage History
| Date | Status | Borrower | Loan Amount |
|---|---|---|---|
| Open | Shoup Thomas E | $67,000 | |
| Closed | Shoup Terry L | $56,000 |
Source: Public Records
Tax History Compared to Growth
Tax History
| Year | Tax Paid | Tax Assessment Tax Assessment Total Assessment is a certain percentage of the fair market value that is determined by local assessors to be the total taxable value of land and additions on the property. | Land | Improvement |
|---|---|---|---|---|
| 2024 | $1,499 | $35,950 | $10,450 | $25,500 |
| 2023 | $1,499 | $35,950 | $10,450 | $25,500 |
| 2022 | $1,250 | $25,560 | $7,470 | $18,090 |
| 2021 | $1,267 | $25,560 | $7,470 | $18,090 |
| 2020 | $1,213 | $25,560 | $7,470 | $18,090 |
| 2019 | $1,195 | $23,700 | $5,300 | $18,400 |
| 2018 | $1,200 | $23,700 | $5,300 | $18,400 |
| 2017 | $1,165 | $23,700 | $5,300 | $18,400 |
| 2016 | $1,165 | $22,610 | $5,300 | $17,310 |
| 2015 | $1,168 | $22,610 | $5,300 | $17,310 |
| 2014 | $1,118 | $22,610 | $5,300 | $17,310 |
Source: Public Records
Map
Nearby Homes