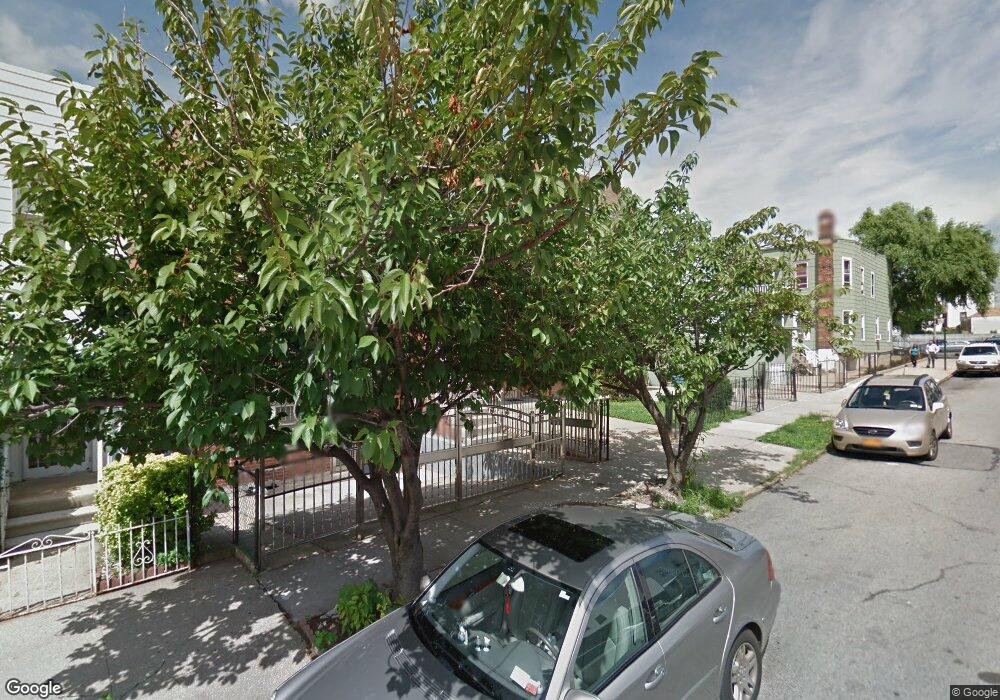
871 Kinsella St Unit 2 Bronx, NY 10462
Van Nest NeighborhoodEstimated Value: $1,117,323 - $1,228,000
3
Beds
1
Bath
1,000
Sq Ft
$1,186/Sq Ft
Est. Value
About This Home
This home is located at 871 Kinsella St Unit 2, Bronx, NY 10462 and is currently estimated at $1,186,081, approximately $1,186 per square foot. 871 Kinsella St Unit 2 is a home located in Bronx County with nearby schools including P.S. 083 The Donald Hertz School, Icahn Charter School 2, and Bronx Excellence 2.
Ownership History
Date
Name
Owned For
Owner Type
Purchase Details
Closed on
Dec 13, 2023
Sold by
Ben Celaj Executor and Estate Of Igballa Celaj
Bought by
Begum Rupa and Nanan Shameer
Current Estimated Value
Home Financials for this Owner
Home Financials are based on the most recent Mortgage that was taken out on this home.
Original Mortgage
$864,000
Outstanding Balance
$848,102
Interest Rate
7.22%
Mortgage Type
Purchase Money Mortgage
Estimated Equity
$337,979
Purchase Details
Closed on
Dec 6, 2011
Sold by
Ben Celaj As Executor and Estate Of Adem Celaj
Bought by
Celaj Igballa
Home Financials for this Owner
Home Financials are based on the most recent Mortgage that was taken out on this home.
Original Mortgage
$8,062
Interest Rate
3.86%
Mortgage Type
Commercial
Purchase Details
Closed on
Feb 6, 2006
Sold by
Celaj Adem
Bought by
Celaj Adem
Create a Home Valuation Report for This Property
The Home Valuation Report is an in-depth analysis detailing your home's value as well as a comparison with similar homes in the area
Home Values in the Area
Average Home Value in this Area
Purchase History
| Date | Buyer | Sale Price | Title Company |
|---|---|---|---|
| Begum Rupa | $1,080,000 | -- | |
| Begum Rupa | $1,080,000 | -- | |
| Celaj Igballa | -- | -- | |
| Celaj Igballa | -- | -- | |
| Celaj Adem | -- | -- | |
| Celaj Adem | -- | -- |
Source: Public Records
Mortgage History
| Date | Status | Borrower | Loan Amount |
|---|---|---|---|
| Open | Begum Rupa | $864,000 | |
| Closed | Begum Rupa | $864,000 | |
| Previous Owner | Celaj Igballa | $8,062 |
Source: Public Records
Tax History Compared to Growth
Tax History
| Year | Tax Paid | Tax Assessment Tax Assessment Total Assessment is a certain percentage of the fair market value that is determined by local assessors to be the total taxable value of land and additions on the property. | Land | Improvement |
|---|---|---|---|---|
| 2025 | $9,163 | $45,878 | $8,444 | $37,434 |
| 2024 | $9,163 | $45,619 | $8,779 | $36,840 |
| 2023 | $8,790 | $43,280 | $8,903 | $34,377 |
| 2022 | $7,864 | $53,220 | $10,380 | $42,840 |
| 2021 | $7,803 | $51,720 | $10,380 | $41,340 |
| 2020 | $7,797 | $44,760 | $10,380 | $34,380 |
| 2019 | $7,660 | $42,420 | $10,380 | $32,040 |
| 2018 | $7,055 | $36,067 | $7,527 | $28,540 |
| 2017 | $6,637 | $34,026 | $9,893 | $24,133 |
| 2016 | $6,107 | $32,100 | $10,380 | $21,720 |
| 2015 | $3,938 | $31,860 | $11,520 | $20,340 |
| 2014 | $3,938 | $31,680 | $11,520 | $20,160 |
Source: Public Records
Map
Nearby Homes
- 868 Morris Park Ave
- - Morris Park Ave
- 867 van Nest Ave
- 848 Morris Park Ave
- 845 Kinsella St
- 874 van Nest Ave
- 856 van Nest Ave
- 1847 Bronxdale Ave
- 930 Morris Park Ave
- 959 van Nest Ave
- 1869 Muliner Ave
- 928 Rhinelander Ave
- 1904 Bronxdale Ave
- 1646 Radcliff Ave
- 1858 Wallace Ave
- 1630 Radcliff Ave
- 953 Rhinelander Ave
- 1925 Bogart Ave
- 1916 Barnes Ave
- 1907 Barnes Ave
- 871 Kinsella St
- 871 Kinsella St Unit 3
- 869 Kinsella St
- 867 Kinsella St
- 1757 Bronxdale Ave
- 1755 Bronxdale Ave
- 1759 Bronxdale Ave
- 865 Kinsella St
- 1753 Bronxdale Ave
- 1753 Bronxdale Ave Unit 1st Floor
- 1761 Bronxdale Ave
- 863 Kinsella St
- 872 Morris Park Ave
- 1763 Bronxdale Ave
- 1765 Bronxdale Ave
- 876 Kinsella St
- 861 Kinsella St Unit 2
- 861 Kinsella St
- 866 Morris Park Ave
- 874 Morris Park Ave