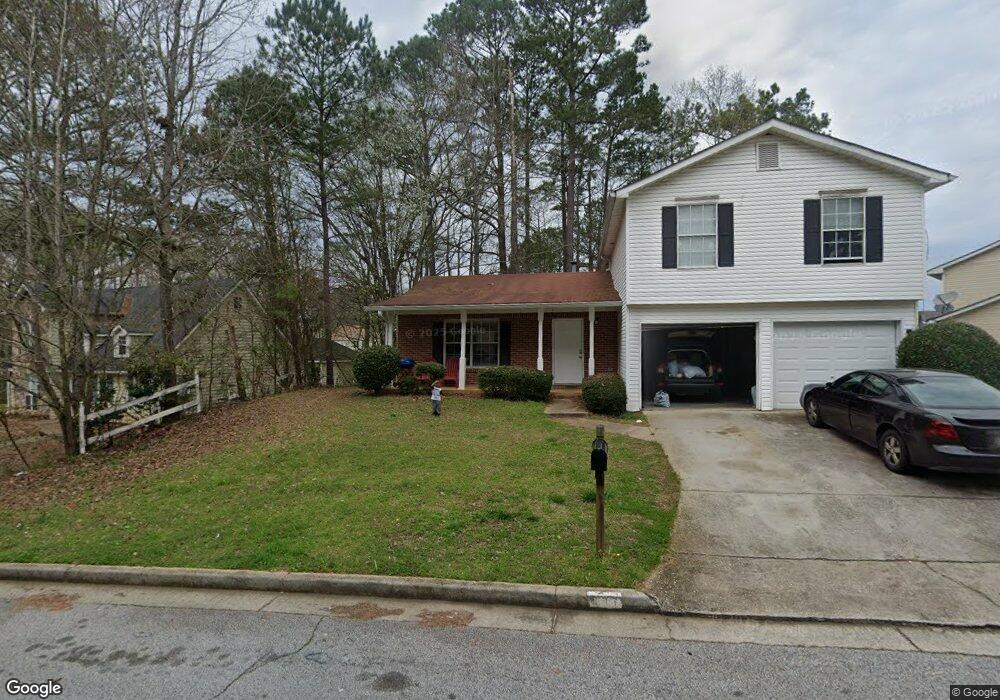
871 Plumbridge Ct Unit 1 Lithonia, GA 30058
Estimated Value: $251,517 - $294,000
3
Beds
3
Baths
1,724
Sq Ft
$153/Sq Ft
Est. Value
About This Home
This home is located at 871 Plumbridge Ct Unit 1, Lithonia, GA 30058 and is currently estimated at $264,379, approximately $153 per square foot. 871 Plumbridge Ct Unit 1 is a home located in DeKalb County with nearby schools including Rock Chapel Elementary School, Stephenson Middle School, and Stephenson High School.
Ownership History
Date
Name
Owned For
Owner Type
Purchase Details
Closed on
Apr 9, 2025
Sold by
Home Sfr Borrower Llc
Bought by
Fyr Sfr Borrower Llc
Current Estimated Value
Purchase Details
Closed on
Apr 8, 2021
Sold by
Arlp Reo 400 Llc
Bought by
Home Sfr Borrower Llc
Purchase Details
Closed on
Aug 18, 2015
Sold by
Ih2 Property Trs 2 Lp
Bought by
Arlp Reo 400 Llc and C/O Altisource Asset Management Corp
Purchase Details
Closed on
Feb 17, 2015
Sold by
Ih2 Property Georgia Lp
Bought by
Ih2 Property Trs 2 Lp
Purchase Details
Closed on
Apr 17, 2013
Sold by
Atlanta Region Sfh I Llc
Bought by
Ih2 Property Georgia Lp
Purchase Details
Closed on
Jun 15, 2012
Sold by
Bltrejv2 Atlanta Residenti
Bought by
Atlanta Region Sfh I Llc
Purchase Details
Closed on
Apr 3, 2012
Sold by
Wright Doris
Bought by
Bltresv2 Atlanta Residential B
Purchase Details
Closed on
Jul 24, 1996
Sold by
Barnes Ent Inc
Bought by
Christian Doris
Create a Home Valuation Report for This Property
The Home Valuation Report is an in-depth analysis detailing your home's value as well as a comparison with similar homes in the area
Home Values in the Area
Average Home Value in this Area
Purchase History
| Date | Buyer | Sale Price | Title Company |
|---|---|---|---|
| Fyr Sfr Borrower Llc | -- | -- | |
| Home Sfr Borrower Llc | -- | -- | |
| Arlp Reo 400 Llc | $30,989,400 | -- | |
| Ih2 Property Trs 2 Lp | -- | -- | |
| Ih2 Property Georgia Lp | $27,002,382 | -- | |
| Atlanta Region Sfh I Llc | $40,262 | -- | |
| Bltresv2 Atlanta Residential B | $35,500 | -- | |
| Christian Doris | $95,000 | -- |
Source: Public Records
Mortgage History
| Date | Status | Borrower | Loan Amount |
|---|---|---|---|
| Closed | Christian Doris | $0 |
Source: Public Records
Tax History Compared to Growth
Tax History
| Year | Tax Paid | Tax Assessment Tax Assessment Total Assessment is a certain percentage of the fair market value that is determined by local assessors to be the total taxable value of land and additions on the property. | Land | Improvement |
|---|---|---|---|---|
| 2025 | $4,996 | $104,640 | $18,000 | $86,640 |
| 2024 | $4,811 | $100,440 | $18,000 | $82,440 |
| 2023 | $4,811 | $60,000 | $7,800 | $52,200 |
| 2022 | $2,946 | $60,000 | $7,800 | $52,200 |
| 2021 | $3,011 | $61,480 | $8,000 | $53,480 |
| 2020 | $2,673 | $53,760 | $8,000 | $45,760 |
| 2019 | $2,135 | $41,520 | $4,982 | $36,538 |
| 2018 | $1,851 | $43,680 | $5,160 | $38,520 |
| 2017 | $2,144 | $43,680 | $5,160 | $38,520 |
| 2016 | $1,457 | $25,880 | $5,176 | $20,704 |
| 2014 | $395 | $25,880 | $5,160 | $20,720 |
Source: Public Records
Map
Nearby Homes
- 660 Kilkenny Cir
- 7427 Asbury Dr
- 616 Kilkenny Cir
- 829 Carlingford Place
- 857 Asbury Trail
- 854 Asbury Trail
- 872 Asbury Trail
- 971 Asborough Ct
- 7531 Edenberry Way
- 7508 Asbury Manor Dr
- 1788 Stephenson Rd
- 775 Edenberry Ln Unit 1
- 7543 Asbury Manor Dr
- 776 Edenberry Ln
- 728 Stonebridge Crescent
- 757 Stonebridge Park Cir
- 751 Stonebridge Park Cir
- 7523 Kimberly Lynn Ct
- 7562 Asbury Manor Dr
- 731 Stonebridge Park Cir
- 877 Plumbridge Ct
- 863 Plumbridge Ct Unit 1
- 665 Kilkenny Cir
- 855 Plumbridge Ct
- 851 Plumbridge Ct
- 669 Kilkenny Cir
- 872 Plumbridge Ct Unit 1
- 878 Plumbridge Ct
- 868 Plumbridge Ct
- 864 Plumbridge Ct Unit 1
- 845 Plumbridge Ct
- 675 Kilkenny Cir
- 862 Plumbridge Ct
- 656 Kilkenny Cir
- 652 Kilkenny Cir
- 652 Kilkenny Cir Unit 39
- 660 Kilkenny Cir
- 858 Plumbridge Ct
- 646 Kilkenny Cir
- 664 Kilkenny Cir