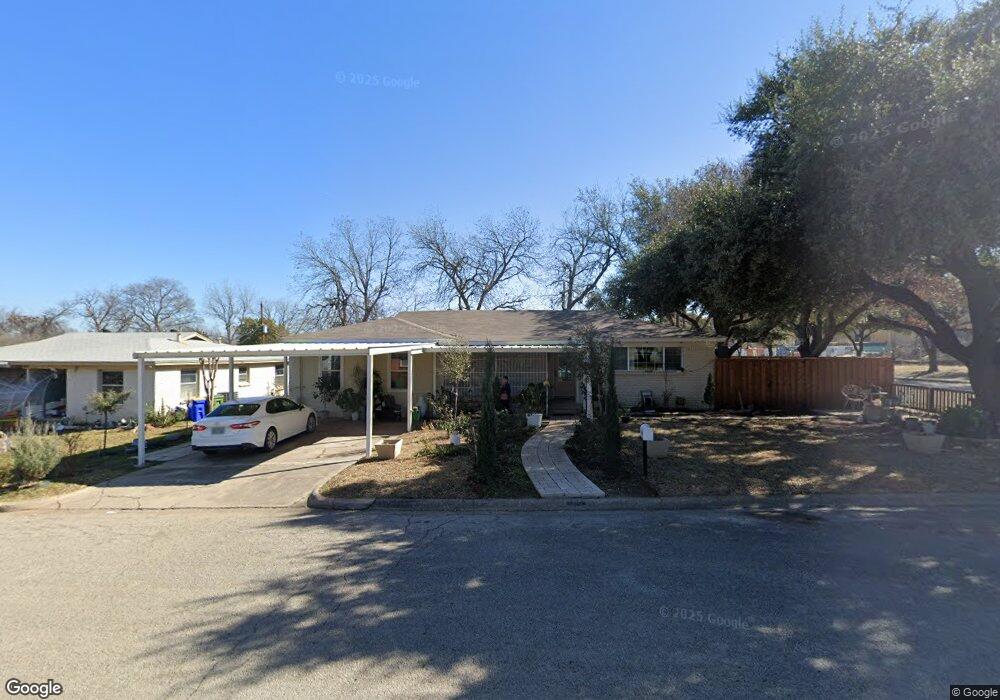
871 Sandell Dr Fort Worth, TX 76108
Estimated Value: $222,000 - $241,536
3
Beds
2
Baths
1,420
Sq Ft
$162/Sq Ft
Est. Value
About This Home
This home is located at 871 Sandell Dr, Fort Worth, TX 76108 and is currently estimated at $230,634, approximately $162 per square foot. 871 Sandell Dr is a home located in Tarrant County with nearby schools including Liberty Elementary School, Brewer Middle School, and Tannahill Intermediate School.
Ownership History
Date
Name
Owned For
Owner Type
Purchase Details
Closed on
May 16, 2018
Sold by
Lowry Harley and Causey Kayeligh
Bought by
Salazar Jesus A and Moreno Juana Sanchez
Current Estimated Value
Home Financials for this Owner
Home Financials are based on the most recent Mortgage that was taken out on this home.
Original Mortgage
$103,500
Outstanding Balance
$75,548
Interest Rate
4.4%
Mortgage Type
Purchase Money Mortgage
Estimated Equity
$155,086
Purchase Details
Closed on
Jul 21, 2016
Sold by
Roberts Teressa Paulette and Forsythe Patty Ann
Bought by
Lowry Harley and Causey Kayleigh
Home Financials for this Owner
Home Financials are based on the most recent Mortgage that was taken out on this home.
Original Mortgage
$93,279
Interest Rate
4.12%
Mortgage Type
FHA
Create a Home Valuation Report for This Property
The Home Valuation Report is an in-depth analysis detailing your home's value as well as a comparison with similar homes in the area
Home Values in the Area
Average Home Value in this Area
Purchase History
| Date | Buyer | Sale Price | Title Company |
|---|---|---|---|
| Salazar Jesus A | -- | None Available | |
| Lowry Harley | -- | Attorney |
Source: Public Records
Mortgage History
| Date | Status | Borrower | Loan Amount |
|---|---|---|---|
| Open | Salazar Jesus A | $103,500 | |
| Previous Owner | Lowry Harley | $93,279 |
Source: Public Records
Tax History Compared to Growth
Tax History
| Year | Tax Paid | Tax Assessment Tax Assessment Total Assessment is a certain percentage of the fair market value that is determined by local assessors to be the total taxable value of land and additions on the property. | Land | Improvement |
|---|---|---|---|---|
| 2025 | $5,254 | $221,784 | $50,031 | $171,753 |
| 2024 | $5,254 | $221,784 | $50,031 | $171,753 |
| 2023 | $5,549 | $233,370 | $50,031 | $183,339 |
| 2022 | $4,701 | $173,573 | $25,000 | $148,573 |
| 2021 | $4,347 | $158,027 | $25,000 | $133,027 |
| 2020 | $3,537 | $127,648 | $25,000 | $102,648 |
| 2019 | $3,587 | $124,698 | $25,000 | $99,698 |
| 2018 | $2,981 | $103,637 | $12,000 | $91,637 |
| 2017 | $2,666 | $91,242 | $12,000 | $79,242 |
| 2016 | $2,343 | $87,932 | $12,000 | $75,932 |
| 2015 | $284 | $72,900 | $10,000 | $62,900 |
| 2014 | $284 | $72,900 | $10,000 | $62,900 |
Source: Public Records
Map
Nearby Homes