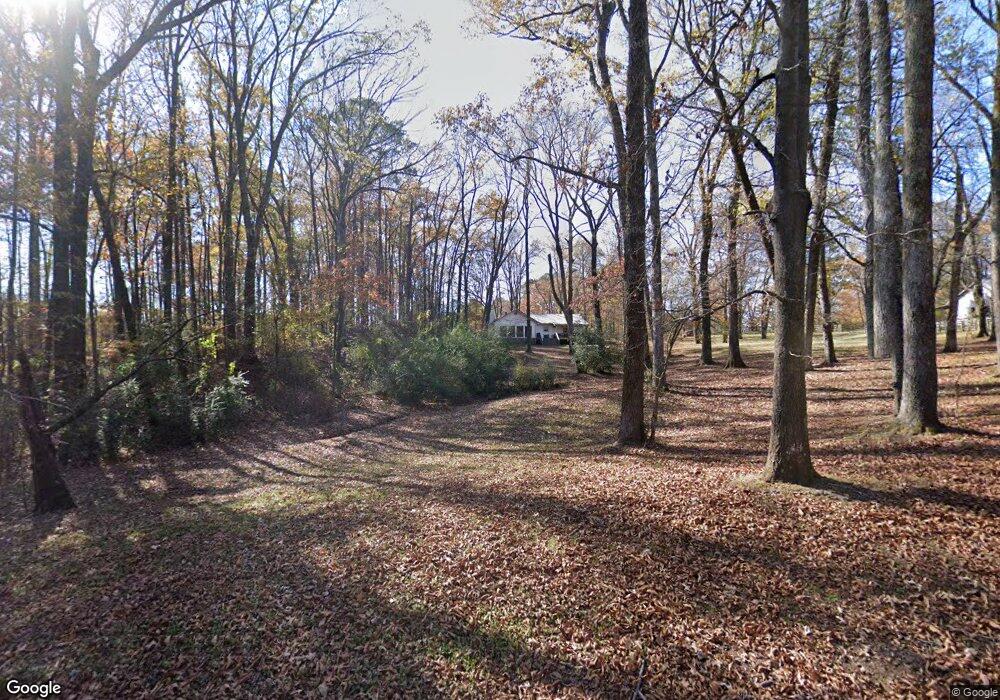
871 Turtle Creek Rd Benton, AR 72015
Estimated Value: $295,578 - $358,000
Studio
3
Baths
1,932
Sq Ft
$163/Sq Ft
Est. Value
About This Home
This home is located at 871 Turtle Creek Rd, Benton, AR 72015 and is currently estimated at $315,395, approximately $163 per square foot. 871 Turtle Creek Rd is a home located in Saline County with nearby schools including Ringgold Elementary School, Benton Middle School, and Benton Junior High School.
Ownership History
Date
Name
Owned For
Owner Type
Purchase Details
Closed on
Jan 3, 2022
Sold by
Moore Jonathan Daniel
Bought by
Moore Jonathan D and Moore Morgan N
Current Estimated Value
Home Financials for this Owner
Home Financials are based on the most recent Mortgage that was taken out on this home.
Original Mortgage
$290,000
Outstanding Balance
$266,212
Interest Rate
3.12%
Mortgage Type
New Conventional
Estimated Equity
$49,183
Purchase Details
Closed on
May 15, 2019
Sold by
Mills Paul A and Mills Susan A
Bought by
Moore Jonathan Daniel
Home Financials for this Owner
Home Financials are based on the most recent Mortgage that was taken out on this home.
Original Mortgage
$222,222
Interest Rate
4%
Mortgage Type
New Conventional
Purchase Details
Closed on
Oct 28, 2005
Sold by
Mccormick Harry F and Mccormick Dorothy S
Bought by
Hopkins Johnny C and Hopkins Lou Ann
Purchase Details
Closed on
Jun 1, 1992
Bought by
Mccormick
Create a Home Valuation Report for This Property
The Home Valuation Report is an in-depth analysis detailing your home's value as well as a comparison with similar homes in the area
Home Values in the Area
Average Home Value in this Area
Purchase History
| Date | Buyer | Sale Price | Title Company |
|---|---|---|---|
| Moore Jonathan D | -- | Lenders Title Company | |
| Moore Jonathan D | -- | Lenders Title Company | |
| Moore Jonathan Daniel | $220,000 | Lenders Title Company | |
| Hopkins Johnny C | -- | -- | |
| Mccormick | -- | -- |
Source: Public Records
Mortgage History
| Date | Status | Borrower | Loan Amount |
|---|---|---|---|
| Open | Moore Jonathan D | $290,000 | |
| Closed | Moore Jonathan D | $290,000 | |
| Previous Owner | Moore Jonathan Daniel | $222,222 |
Source: Public Records
Tax History
| Year | Tax Paid | Tax Assessment Tax Assessment Total Assessment is a certain percentage of the fair market value that is determined by local assessors to be the total taxable value of land and additions on the property. | Land | Improvement |
|---|---|---|---|---|
| 2025 | $2,148 | $46,978 | $8,400 | $38,578 |
| 2024 | $2,148 | $46,978 | $8,400 | $38,578 |
| 2023 | $1,725 | $46,978 | $8,400 | $38,578 |
| 2022 | $1,681 | $46,978 | $8,400 | $38,578 |
| 2021 | $1,588 | $36,200 | $6,000 | $30,200 |
| 2020 | $1,543 | $36,200 | $6,000 | $30,200 |
| 2019 | $1,543 | $36,200 | $6,000 | $30,200 |
| 2018 | $1,568 | $36,200 | $6,000 | $30,200 |
| 2017 | $1,499 | $36,200 | $6,000 | $30,200 |
| 2016 | $1,713 | $33,200 | $6,000 | $27,200 |
| 2015 | $1,413 | $33,200 | $6,000 | $27,200 |
| 2014 | $1,413 | $33,200 | $6,000 | $27,200 |
Source: Public Records
Map
Nearby Homes
- 20 acre River Rd
- 4876 Highway 67
- 5415 U S 67
- 529 Dodson Creek Rd
- 24 Acres Interstate 30
- 3.25 Hwy 67
- 0 Mountain View Rd Unit 26001490
- 110 Harmony Village Dr
- 102 Red Crest Cove
- 111 Harmony Village Dr
- 113 Harmony Village Dr
- Lot 91 Harmony Village Dr
- Lot 89 Harmony Village Dr
- 105 Dylan
- 115 Red Wing Way
- 113 Red Wing Way
- 122 Harmony Village Dr
- 119 Harmony Village Dr
- Lot 90 Harmony Village
- 123 Harmony Village Dr
- 871 Turtle Creek Rd
- 871 Turtle Creek Rd
- 163 Turtle Creek Rd
- 177 Turtle Creek Rd
- 851 Turtle Creek Rd
- 219 Turtle Creek Rd
- 149 Turtle Creek Rd
- 865 Turtle Creek Rd
- 856 Turtle Creek Rd
- 921 River Rd
- 848 Turtle Creek Rd
- 253 Turtle Creek Rd
- 823 Turtle Creek Rd
- 938 Turtle Creek Rd
- 162 Turtle Creek Rd
- 162 Turtle Creek Rd
- 107 Turtle Creek Rd
- 232 Turtle Creek Rd
- 822 Turtle Creek Rd
- 805 Turtle Creek Rd
Your Personal Tour Guide
Ask me questions while you tour the home.