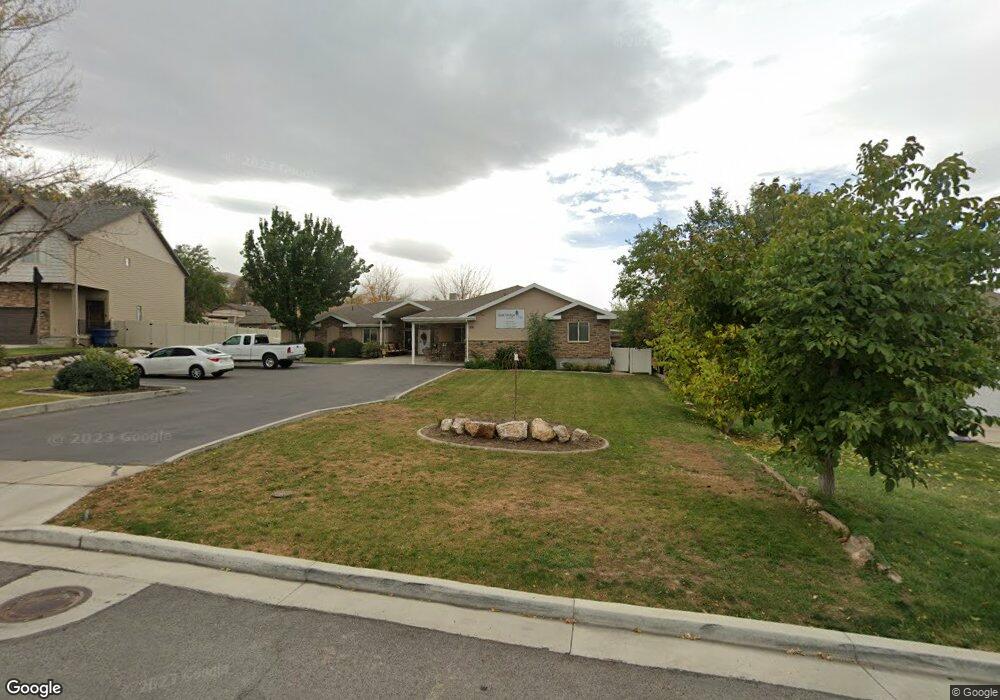
871 W 4000 S Bountiful, UT 84010
Estimated Value: $550,000 - $650,000
6
Beds
4
Baths
2,300
Sq Ft
$258/Sq Ft
Est. Value
About This Home
This home is located at 871 W 4000 S, Bountiful, UT 84010 and is currently estimated at $593,942, approximately $258 per square foot. 871 W 4000 S is a home located in Davis County with nearby schools including Adelaide School, South Davis Junior High School, and Woods Cross High School.
Ownership History
Date
Name
Owned For
Owner Type
Purchase Details
Closed on
Dec 7, 2004
Sold by
Mordue Steven S and Mordue Karen E
Bought by
Porter David C
Current Estimated Value
Home Financials for this Owner
Home Financials are based on the most recent Mortgage that was taken out on this home.
Original Mortgage
$171,100
Interest Rate
5.64%
Mortgage Type
Purchase Money Mortgage
Purchase Details
Closed on
Nov 30, 2004
Sold by
Porter David C
Bought by
Porter Properties Llc
Home Financials for this Owner
Home Financials are based on the most recent Mortgage that was taken out on this home.
Original Mortgage
$171,100
Interest Rate
5.64%
Mortgage Type
Purchase Money Mortgage
Purchase Details
Closed on
Mar 27, 1998
Sold by
Mordue Steven S
Bought by
Mordue Steven S and Mordue Karen E
Home Financials for this Owner
Home Financials are based on the most recent Mortgage that was taken out on this home.
Original Mortgage
$97,800
Interest Rate
7%
Create a Home Valuation Report for This Property
The Home Valuation Report is an in-depth analysis detailing your home's value as well as a comparison with similar homes in the area
Purchase History
| Date | Buyer | Sale Price | Title Company |
|---|---|---|---|
| Porter David C | -- | Millcreek Land Title Ins | |
| Porter Properties Llc | -- | Millcreek Land Title Ins | |
| Mordue Steven S | -- | Associated Title Company |
Source: Public Records
Mortgage History
| Date | Status | Borrower | Loan Amount |
|---|---|---|---|
| Closed | Porter David C | $171,100 | |
| Previous Owner | Mordue Steven S | $97,800 |
Source: Public Records
Tax History
| Year | Tax Paid | Tax Assessment Tax Assessment Total Assessment is a certain percentage of the fair market value that is determined by local assessors to be the total taxable value of land and additions on the property. | Land | Improvement |
|---|---|---|---|---|
| 2025 | $640 | $300,300 | $163,313 | $136,987 |
| 2024 | $413 | $272,249 | $163,136 | $109,113 |
| 2023 | $2,853 | $258,500 | $146,240 | $112,259 |
| 2022 | $2,829 | $491,000 | $266,824 | $224,176 |
| 2021 | $507 | $391,000 | $192,437 | $198,563 |
| 2020 | $2,428 | $344,000 | $161,054 | $182,946 |
| 2019 | $2,454 | $341,000 | $149,082 | $191,918 |
| 2018 | $2,236 | $310,000 | $145,688 | $164,312 |
| 2016 | $1,710 | $135,740 | $57,730 | $78,010 |
| 2015 | $1,577 | $118,910 | $57,730 | $61,180 |
| 2014 | $1,791 | $137,830 | $57,730 | $80,100 |
| 2013 | -- | $117,914 | $44,876 | $73,038 |
Source: Public Records
Map
Nearby Homes
- 189 E 210 N Unit 8
- 187 E 210 N Unit 7
- 252 E Kirsten Ln
- 240 Odell Ln
- 246 N Glenwood Way
- 2420 S Orchard Dr
- 366 N 175 E
- 3573 S Highway 89
- 553 E 175 N
- 25 E Center St Unit 56
- 25 E Center St Unit 81
- 562 Lancelot Dr Unit 60
- 371 E 100 S
- 246 Guenevere St Unit 81
- 178 N Valley View Dr
- 310 N 675 E
- 520 Lacey Way
- 652 W 3600 S
- 256 Excalibur St Unit 163
- 638 Scenic Hills Dr