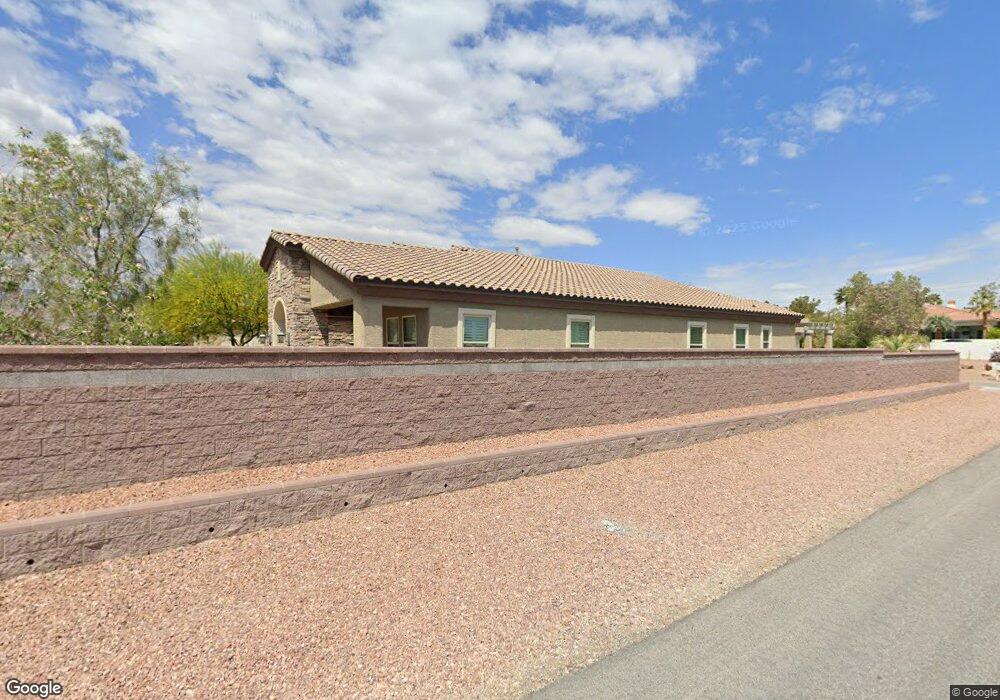
8710 Desert Brook Cir Las Vegas, NV 89149
Estimated Value: $1,036,691 - $1,192,000
4
Beds
4
Baths
3,615
Sq Ft
$311/Sq Ft
Est. Value
About This Home
This home is located at 8710 Desert Brook Cir, Las Vegas, NV 89149 and is currently estimated at $1,125,673, approximately $311 per square foot. 8710 Desert Brook Cir is a home located in Clark County with nearby schools including Dean Lamar Allen Elementary School, Justice Myron E Leavitt Middle School, and Centennial High School.
Ownership History
Date
Name
Owned For
Owner Type
Purchase Details
Closed on
Jul 14, 2016
Sold by
D R Horton Inc
Bought by
Guthrie Donald W and Guthrie Twila M
Current Estimated Value
Home Financials for this Owner
Home Financials are based on the most recent Mortgage that was taken out on this home.
Original Mortgage
$505,734
Outstanding Balance
$401,018
Interest Rate
3.54%
Mortgage Type
VA
Estimated Equity
$724,655
Purchase Details
Closed on
Mar 30, 2015
Sold by
Ginoza Kathryn and White Nanella
Bought by
Ginoza Kathryn and White Nanella
Purchase Details
Closed on
Feb 9, 2015
Sold by
Anderson H Michael
Bought by
Anderson Michelle
Purchase Details
Closed on
Sep 13, 2011
Sold by
Dondero Alan G
Bought by
Dondero Properties Llc
Purchase Details
Closed on
Dec 13, 2007
Sold by
Not Provided
Bought by
Kodama Jane S and Dondero Alan G
Create a Home Valuation Report for This Property
The Home Valuation Report is an in-depth analysis detailing your home's value as well as a comparison with similar homes in the area
Home Values in the Area
Average Home Value in this Area
Purchase History
| Date | Buyer | Sale Price | Title Company |
|---|---|---|---|
| Guthrie Donald W | $554,990 | Dhi Title Of Nevada | |
| Ginoza Kathryn | -- | First American Title Ncs La | |
| Anderson Michelle | -- | First American Title Ncs La | |
| Dondero Properties Llc | -- | None Available | |
| Kodama Jane S | $4,590,325 | National Title Company |
Source: Public Records
Mortgage History
| Date | Status | Borrower | Loan Amount |
|---|---|---|---|
| Open | Guthrie Donald W | $505,734 |
Source: Public Records
Tax History Compared to Growth
Tax History
| Year | Tax Paid | Tax Assessment Tax Assessment Total Assessment is a certain percentage of the fair market value that is determined by local assessors to be the total taxable value of land and additions on the property. | Land | Improvement |
|---|---|---|---|---|
| 2025 | $6,080 | $349,826 | $84,000 | $265,826 |
| 2024 | $6,814 | $349,826 | $84,000 | $265,826 |
| 2023 | $6,814 | $379,563 | $95,550 | $284,013 |
| 2022 | $6,616 | $312,274 | $69,300 | $242,974 |
| 2021 | $6,423 | $282,863 | $64,050 | $218,813 |
| 2020 | $6,122 | $254,436 | $61,600 | $192,836 |
| 2019 | $5,439 | $227,009 | $47,250 | $179,759 |
| 2018 | $5,280 | $193,954 | $42,000 | $151,954 |
| 2017 | $5,127 | $188,036 | $42,000 | $146,036 |
| 2016 | $5,348 | $37,800 | $37,800 | $0 |
| 2015 | $653 | $21,000 | $21,000 | $0 |
| 2014 | $573 | $26,250 | $26,250 | $0 |
Source: Public Records
Map
Nearby Homes
- 5215 N Riley St
- 4925 N Juliano Rd
- 0 W Rosada Way Unit 2735462
- 8775 W Verde Way
- 11127 Rolling Vista Dr
- 8525 W Verde Way
- 2 W Lone Mountain Rd
- 5112 Crown Cypress St
- 8810 W Stephen Ave
- 8826 W Stephen Ave
- 8842 W Stephen Ave
- 8975 W Verde Way
- 5321 N Durango Dr
- 8970 W Lone Mountain Rd
- 9180 W Hammer Ln
- 0 Dapple Gray Rd
- 5515 N Campbell Rd
- 5625 Coe Estates Ct
- 4996 Moncada Way
- 4798 Luna Ridge Ct
- 8710 Desert Brook Cir Unit 4-31
- 8730 Desert Brook Cir
- 8711 Desert Brook Cir
- 5175 N Juliano Rd
- 8731 Desert Brook Cir
- 5138 N Juliano Rd
- 5160 N Juliano Rd
- 8750 Desert Brook Cir
- 8721 W Washburn Rd
- 8751 Desert Brook Cir Unit 2-32
- 8751 Desert Brook Cir
- 8735 W Washburn Rd
- 8749 W Washburn Rd Unit X
- 8712 Kendall Brook Cir
- 8770 Desert Brook Cir
- 8771 Desert Brook Cir
- 8767 W Washburn Rd
- 5160 N El Capitan Way
- 8752 Kendall Brook Cir
- 8777 W Washburn Rd