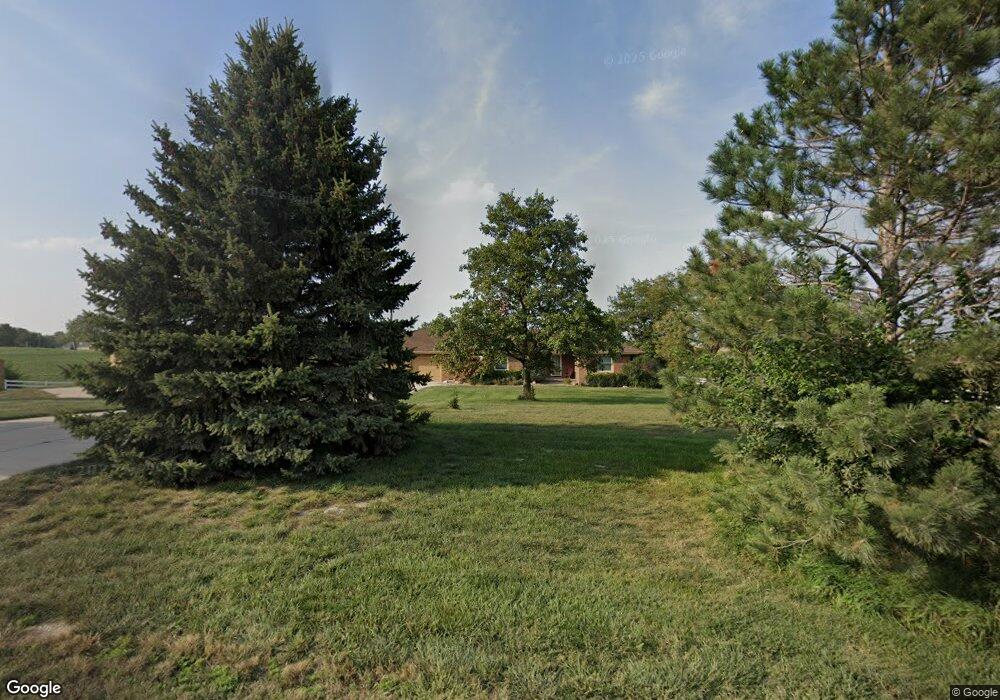
8710 Fairview Rd Papillion, NE 68046
Estimated Value: $552,000 - $730,372
3
Beds
3
Baths
2,455
Sq Ft
$252/Sq Ft
Est. Value
About This Home
This home is located at 8710 Fairview Rd, Papillion, NE 68046 and is currently estimated at $619,093, approximately $252 per square foot. 8710 Fairview Rd is a home located in Sarpy County with nearby schools including Platteview Central Junior High School and Platteview Senior High School.
Ownership History
Date
Name
Owned For
Owner Type
Purchase Details
Closed on
Dec 20, 2013
Sold by
Feekin Jeffrey Scott and Feekin Jeffrey S
Bought by
Feekin Jeffrey S and The Jeffrey S Feekin Revocable Living Tr
Current Estimated Value
Purchase Details
Closed on
Jul 23, 2012
Sold by
Feekin Mark A and Keekin Tiana T
Bought by
Feekin Jeffrey Scott
Purchase Details
Closed on
Jul 27, 2011
Sold by
Bonge Deborah Jean and Bonge James
Bought by
Feekin Mark A and Feekin Tiana T
Purchase Details
Closed on
May 21, 2001
Sold by
Jean Tabor Deborah and Jean Deborah Jean
Bought by
Konyek Deborah Jean
Purchase Details
Closed on
Feb 17, 2000
Sold by
Tabor Mark Franklin
Bought by
Tabor Deborah Jean
Purchase Details
Closed on
Jul 15, 1998
Sold by
Santrust Santrust I and Santrust Cynthia L
Bought by
Tabor Mark and Tabor Deborah Jean
Home Financials for this Owner
Home Financials are based on the most recent Mortgage that was taken out on this home.
Original Mortgage
$150,000
Interest Rate
7.05%
Create a Home Valuation Report for This Property
The Home Valuation Report is an in-depth analysis detailing your home's value as well as a comparison with similar homes in the area
Home Values in the Area
Average Home Value in this Area
Purchase History
| Date | Buyer | Sale Price | Title Company |
|---|---|---|---|
| Feekin Jeffrey S | -- | None Available | |
| Feekin Jeffrey Scott | $317,000 | None Available | |
| Feekin Mark A | $305,000 | Omaha Title & Escrow Inc | |
| Konyek Deborah Jean | -- | Suburban Title & Escrow | |
| Tabor Deborah Jean | -- | -- | |
| Tabor Mark | $231,000 | -- |
Source: Public Records
Mortgage History
| Date | Status | Borrower | Loan Amount |
|---|---|---|---|
| Previous Owner | Tabor Mark | $150,000 | |
| Closed | Konyek Deborah Jean | $0 |
Source: Public Records
Tax History
| Year | Tax Paid | Tax Assessment Tax Assessment Total Assessment is a certain percentage of the fair market value that is determined by local assessors to be the total taxable value of land and additions on the property. | Land | Improvement |
|---|---|---|---|---|
| 2025 | $4,771 | $646,628 | $259,600 | $387,028 |
| 2024 | $6,083 | $575,229 | $211,450 | $363,779 |
| 2023 | $6,083 | $526,608 | $211,780 | $314,828 |
| 2022 | $6,233 | $492,964 | $210,600 | $282,364 |
| 2021 | $6,147 | $437,273 | $204,840 | $232,433 |
| 2020 | $6,485 | $430,442 | $191,688 | $238,754 |
| 2019 | $6,374 | $423,807 | $171,460 | $252,347 |
| 2018 | $5,987 | $389,042 | $148,020 | $241,022 |
| 2017 | $5,743 | $368,100 | $133,740 | $234,360 |
| 2016 | $5,622 | $354,224 | $133,740 | $220,484 |
| 2015 | $5,594 | $351,206 | $128,200 | $223,006 |
| 2014 | $5,667 | $353,736 | $128,200 | $225,536 |
| 2012 | -- | $344,195 | $128,200 | $215,995 |
Source: Public Records
Map
Nearby Homes
- 9865 Fowler Dr
- 12511 S 87th St
- 8958 Von St
- 8954 Von St
- 12614 S 82nd St
- 12509 S 89th St
- 12704 S 79th St
- 12502 S 89th St
- 12520 S 89th Ave Unit Lot 103
- 12524 S 89th Ave Unit Lot 102
- 12512 S 89th Ave Unit Lot 105
- 12405 S 89th Ave Unit Lot 51
- 12354 S 89th Ave Unit Lot 117
- 12426 S 89th Ave Unit Lot 108
- 12318 S 89th Ave Unit Lot 118
- 12418 S 89th Ave Unit Lot 110
- 12516 S 89th Ave Unit Lot 104
- 12508 S 89th Ave Unit Lot 106
- 12358 S 89th Ave Unit Lot 116
- 12504 S 89th Ave Unit Lot 107
- 8908 Fairview Rd
- 8912 Fairview Rd
- 13814 S 84th St
- 9005 Fairview Rd
- 14110 S 84th St
- 13810 S 84th St
- 9004 Fairview Rd
- 13714 S 84th St
- 14400 S 84th St
- 8101 Fairview Rd
- 13611 S 84th St
- 9305 Fairview Rd
- 9402 Fairview Rd
- 14516 S 84th St
- 8035 Fairview Rd
- 8103 Fairview Rd
- 8020 Fairview Rd
- 14121 S 96th St
- 14605 S 84th St
- 8008 Fairview Rd
Your Personal Tour Guide
Ask me questions while you tour the home.