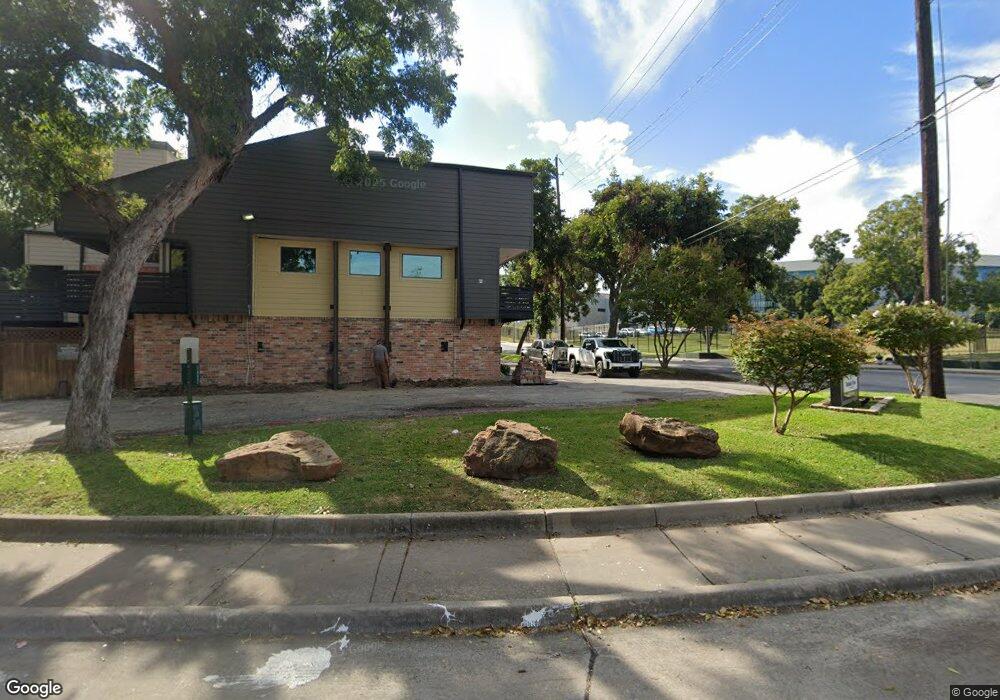
8710B Park Ln Unit B4 Dallas, TX 75231
Vickery NeighborhoodEstimated Value: $139,000 - $198,000
1
Bed
2
Baths
1,082
Sq Ft
$148/Sq Ft
Est. Value
About This Home
This home is located at 8710B Park Ln Unit B4, Dallas, TX 75231 and is currently estimated at $160,543, approximately $148 per square foot. 8710B Park Ln Unit B4 is a home located in Dallas County with nearby schools including Geneva Heights Elementary, Sam Tasby Middle School, and Emmett J Conrad High School.
Ownership History
Date
Name
Owned For
Owner Type
Purchase Details
Closed on
Oct 27, 2025
Sold by
Pensco Trust Company and Sabrina Bunks Ira
Bought by
Digital Trust and Sabrina Bunks Roth
Current Estimated Value
Purchase Details
Closed on
Nov 28, 2007
Sold by
Hud
Bought by
Navalta Ii Dominador Gabriel
Home Financials for this Owner
Home Financials are based on the most recent Mortgage that was taken out on this home.
Original Mortgage
$51,000
Interest Rate
6.43%
Mortgage Type
Purchase Money Mortgage
Purchase Details
Closed on
Jan 5, 2007
Sold by
Flagstar Bank Fsb
Bought by
Hud
Purchase Details
Closed on
Jan 2, 2007
Sold by
Ward Samuel T
Bought by
Flagstar Bank Fsb
Purchase Details
Closed on
Jul 21, 2005
Sold by
Alan Management
Bought by
Ward Samuel T
Home Financials for this Owner
Home Financials are based on the most recent Mortgage that was taken out on this home.
Original Mortgage
$58,200
Interest Rate
5.61%
Mortgage Type
FHA
Create a Home Valuation Report for This Property
The Home Valuation Report is an in-depth analysis detailing your home's value as well as a comparison with similar homes in the area
Home Values in the Area
Average Home Value in this Area
Purchase History
| Date | Buyer | Sale Price | Title Company |
|---|---|---|---|
| Digital Trust | -- | None Listed On Document | |
| Navalta Ii Dominador Gabriel | $51,000 | None Available | |
| Hud | -- | None Available | |
| Flagstar Bank Fsb | $62,596 | None Available | |
| Ward Samuel T | -- | -- |
Source: Public Records
Mortgage History
| Date | Status | Borrower | Loan Amount |
|---|---|---|---|
| Previous Owner | Navalta Ii Dominador Gabriel | $51,000 | |
| Previous Owner | Ward Samuel T | $58,200 |
Source: Public Records
Tax History Compared to Growth
Tax History
| Year | Tax Paid | Tax Assessment Tax Assessment Total Assessment is a certain percentage of the fair market value that is determined by local assessors to be the total taxable value of land and additions on the property. | Land | Improvement |
|---|---|---|---|---|
| 2025 | $2,833 | $121,320 | $30,390 | $90,930 |
| 2024 | $2,833 | $121,320 | $30,390 | $90,930 |
| 2023 | $2,833 | $121,320 | $30,390 | $90,930 |
| 2022 | $3,033 | $121,320 | $30,390 | $90,930 |
| 2021 | $3,200 | $121,320 | $30,390 | $90,930 |
| 2020 | $2,935 | $108,200 | $0 | $0 |
| 2019 | $1,970 | $69,250 | $30,390 | $38,860 |
| 2018 | $1,493 | $54,910 | $30,390 | $24,520 |
| 2017 | $1,493 | $54,910 | $30,390 | $24,520 |
| 2016 | $1,177 | $43,280 | $10,130 | $33,150 |
| 2015 | $1,171 | $60,590 | $10,130 | $50,460 |
| 2014 | $1,171 | $56,260 | $10,130 | $46,130 |
Source: Public Records
Map
Nearby Homes
- 6808 Eastridge Dr Unit 12- B3
- 8750 Park Ln Unit 147
- 8601 Park Ln Unit 523E
- 8601 Park Ln Unit 221B
- 8601 Park Ln Unit 414
- 8601 Park Ln Unit 111A
- 8601 Park Ln Unit 624
- 8601 Park Ln Unit 121A
- 8601 Park Ln Unit 721G
- 8601 Park Ln Unit 612
- 8560 Park Ln Unit 29
- 6620 Eastridge Dr Unit 219
- 6122 Ridgecrest Rd Unit 2007
- 7152 Fair Oaks Ave Unit 1039
- 7152 Fair Oaks Ave Unit 1181
- 7152 Fair Oaks Ave Unit 1029
- 6119 Summer Creek Cir
- 6107 Summer Creek Cir
- 7125 Fair Oaks Ave Unit 12A
- 6050 Melody Ln Unit 341
- 8710C Park Ln Unit C5
- 8710B Park Ln Unit B3
- 8710C Park Ln Unit C8
- 8710B Park Ln Unit B7
- 8710B Park Ln Unit B6
- 8710C Park Ln Unit C7
- 8710C Park Ln Unit C2
- 8710C Park Ln Unit C6
- 8710C Park Ln Unit C4
- 8710C Park Ln Unit C3
- 8710C Park Ln Unit C1
- 8710B Park Ln Unit B5
- 8710B Park Ln Unit B2
- 8710B Park Ln Unit B1
- 8710A Park Ln Unit A4
- 8710A Park Ln Unit A5
- 8710A Park Ln Unit A3
- 8710A Park Ln Unit A2
- 8710A Park Ln Unit A1
- 8710 Park Ln