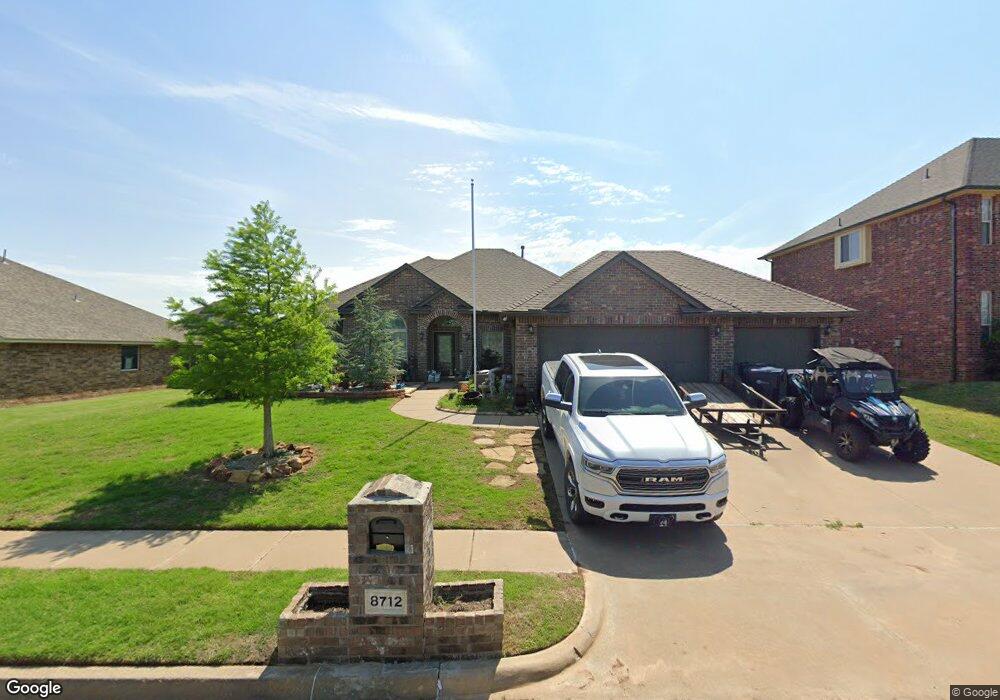
8712 Ally Way Yukon, OK 73099
Harvest Hills West NeighborhoodEstimated Value: $338,741 - $379,000
--
Bed
--
Bath
2,510
Sq Ft
$142/Sq Ft
Est. Value
About This Home
This home is located at 8712 Ally Way, Yukon, OK 73099 and is currently estimated at $355,935, approximately $141 per square foot. 8712 Ally Way is a home located in Canadian County with nearby schools including Surrey Hills Elementary School, Redstone Intermediate School, and Yukon Middle School.
Ownership History
Date
Name
Owned For
Owner Type
Purchase Details
Closed on
May 16, 2014
Sold by
Jordon Jennifer and Sommer Jennifer
Bought by
Wathor Douglas and Jordon Jennifer
Current Estimated Value
Purchase Details
Closed on
Sep 30, 2013
Sold by
Nithlanandan Dheenoth and Nithianandan Jessica
Bought by
Sommer Jennifer
Purchase Details
Closed on
Nov 15, 2010
Sold by
D R Horton Texas Ltd L P
Bought by
Nithianandan Dheenoth
Home Financials for this Owner
Home Financials are based on the most recent Mortgage that was taken out on this home.
Original Mortgage
$189,183
Interest Rate
4.4%
Mortgage Type
FHA
Create a Home Valuation Report for This Property
The Home Valuation Report is an in-depth analysis detailing your home's value as well as a comparison with similar homes in the area
Home Values in the Area
Average Home Value in this Area
Purchase History
| Date | Buyer | Sale Price | Title Company |
|---|---|---|---|
| Wathor Douglas | -- | None Available | |
| Sommer Jennifer | $225,000 | Investors Title & Escrow Co | |
| Nithianandan Dheenoth | $194,500 | American Eagle Title Ins Co |
Source: Public Records
Mortgage History
| Date | Status | Borrower | Loan Amount |
|---|---|---|---|
| Previous Owner | Nithianandan Dheenoth | $189,183 |
Source: Public Records
Tax History Compared to Growth
Tax History
| Year | Tax Paid | Tax Assessment Tax Assessment Total Assessment is a certain percentage of the fair market value that is determined by local assessors to be the total taxable value of land and additions on the property. | Land | Improvement |
|---|---|---|---|---|
| 2024 | $3,684 | $32,125 | $3,300 | $28,825 |
| 2023 | $3,684 | $30,595 | $3,300 | $27,295 |
| 2022 | $3,530 | $29,138 | $3,300 | $25,838 |
| 2021 | $3,344 | $27,751 | $3,300 | $24,451 |
| 2020 | $3,160 | $26,430 | $3,300 | $23,130 |
| 2019 | $3,010 | $25,171 | $3,300 | $21,871 |
| 2018 | $3,124 | $26,099 | $3,300 | $22,799 |
| 2017 | $3,110 | $26,099 | $3,300 | $22,799 |
| 2016 | $3,111 | $26,506 | $3,300 | $23,206 |
| 2015 | -- | $24,913 | $3,300 | $21,613 |
| 2014 | -- | $27,031 | $3,300 | $23,731 |
Source: Public Records
Map
Nearby Homes
- 9009 NW 85th St
- 9012 NW 85th St
- 9001 NW 84th St
- 8805 Dena Ln
- 8712 Kate Crossing
- 8700 Kate Crossing
- 8736 Kate Crossing
- 9205 NW 86th St
- 9016 NW 84th Terrace
- 8800 NW 86th St
- 9216 NW 86th St
- 9005 Stacy Lynn Ln
- 9221 NW 86th St
- 9225 NW 86th St
- 9213 NW 84th St
- 9229 NW 86th St
- 9228 NW 87th St
- 9233 NW 86th Terrace
- 9232 NW 87th St
- 9233 NW 87th St
- 8708 Ally Way
- 8716 Ally Way
- 8713 Stacy Lynn Ln
- 8717 Stacy Lynn Ln
- 8720 Ally Way
- 8709 Stacy Lynn Ln
- 9013 NW 86th St
- 9017 NW 86th St
- 8721 Stacy Lynn Ln
- 9100 NW 86th Ct
- 8705 Stacy Lynn Ln
- 8724 Ally Way
- 8725 Stacy Lynn Ln
- 9105 NW 86th Ct
- 8721 Ally Way
- 9104 NW 86th Ct
- 9101 NW 86th St
- 8716 Stacy Lynn Ln
- 8728 Ally Way
- 8720 Stacy Lynn Ln