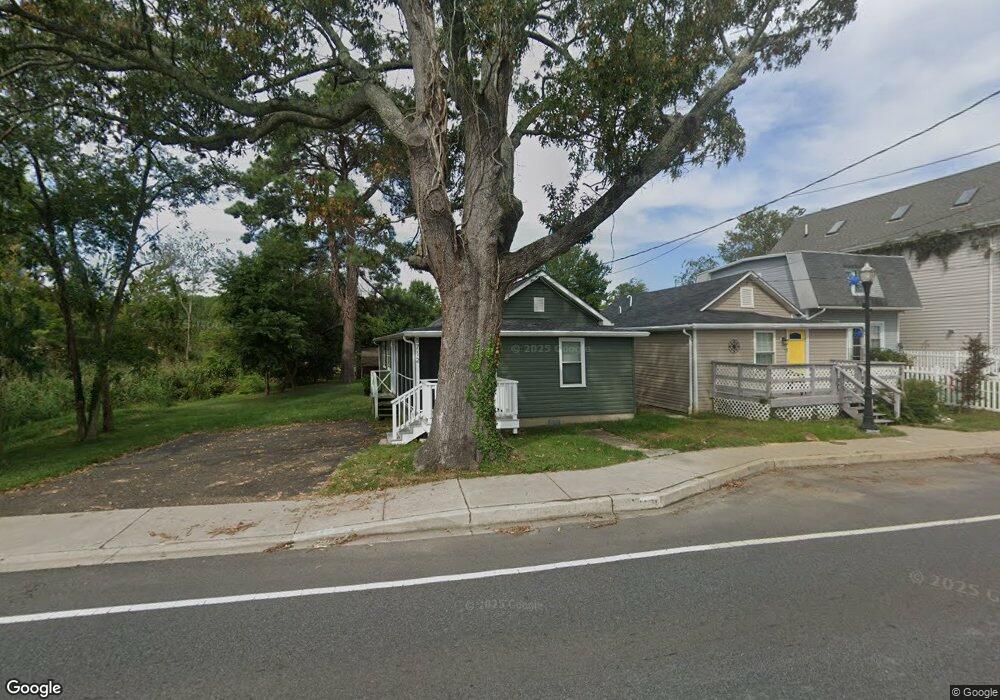
8712 Bayside Rd Chesapeake Beach, MD 20732
Estimated Value: $247,000 - $331,000
3
Beds
1
Bath
690
Sq Ft
$427/Sq Ft
Est. Value
About This Home
This home is located at 8712 Bayside Rd, Chesapeake Beach, MD 20732 and is currently estimated at $294,703, approximately $427 per square foot. 8712 Bayside Rd is a home located in Calvert County with nearby schools including Windy Hill Elementary School, Windy Hill Middle School, and Northern High School.
Ownership History
Date
Name
Owned For
Owner Type
Purchase Details
Closed on
May 28, 2021
Sold by
Root Quintin C and Root Deborah L
Bought by
Wannop Collin T and Wannop Nataly M
Current Estimated Value
Home Financials for this Owner
Home Financials are based on the most recent Mortgage that was taken out on this home.
Original Mortgage
$10,000
Outstanding Balance
$9,054
Interest Rate
2.9%
Mortgage Type
Unknown
Estimated Equity
$285,649
Purchase Details
Closed on
Jul 2, 1985
Sold by
Bequeaith Donald D and Bequeaith Joyce A
Bought by
Root Quintin C and Root Deborah L
Purchase Details
Closed on
Jun 5, 1984
Sold by
Gegor Andrew
Bought by
Bequeaith Donald D and Bequeaith Joyce A
Home Financials for this Owner
Home Financials are based on the most recent Mortgage that was taken out on this home.
Original Mortgage
$15,000
Interest Rate
14.29%
Create a Home Valuation Report for This Property
The Home Valuation Report is an in-depth analysis detailing your home's value as well as a comparison with similar homes in the area
Home Values in the Area
Average Home Value in this Area
Purchase History
| Date | Buyer | Sale Price | Title Company |
|---|---|---|---|
| Wannop Collin T | $288,400 | Brennan Title Company | |
| Root Quintin C | $54,000 | -- | |
| Bequeaith Donald D | $20,000 | -- |
Source: Public Records
Mortgage History
| Date | Status | Borrower | Loan Amount |
|---|---|---|---|
| Open | Wannop Collin T | $10,000 | |
| Open | Wannop Collin T | $283,176 | |
| Previous Owner | Bequeaith Donald D | $15,000 |
Source: Public Records
Tax History Compared to Growth
Tax History
| Year | Tax Paid | Tax Assessment Tax Assessment Total Assessment is a certain percentage of the fair market value that is determined by local assessors to be the total taxable value of land and additions on the property. | Land | Improvement |
|---|---|---|---|---|
| 2025 | $1,879 | $172,800 | $91,700 | $81,100 |
| 2024 | $1,879 | $165,467 | $0 | $0 |
| 2023 | $1,736 | $158,133 | $0 | $0 |
| 2022 | $1,688 | $150,800 | $91,700 | $59,100 |
| 2021 | $1,688 | $149,767 | $0 | $0 |
| 2020 | $1,690 | $148,733 | $0 | $0 |
| 2019 | $1,554 | $147,700 | $91,700 | $56,000 |
| 2018 | $1,561 | $147,700 | $91,700 | $56,000 |
| 2017 | $1,730 | $147,700 | $0 | $0 |
| 2016 | -- | $149,100 | $0 | $0 |
| 2015 | $1,768 | $149,100 | $0 | $0 |
| 2014 | $1,768 | $149,100 | $0 | $0 |
Source: Public Records
Map
Nearby Homes