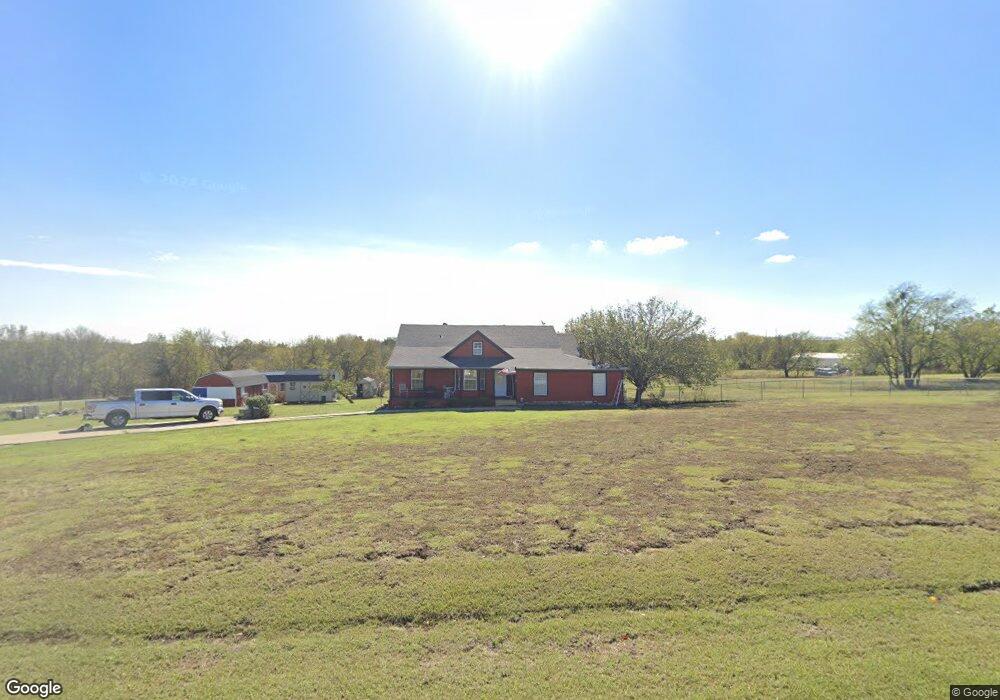
8712 County Road 878 Princeton, TX 75407
Estimated Value: $306,000 - $439,000
3
Beds
2
Baths
1,684
Sq Ft
$214/Sq Ft
Est. Value
About This Home
This home is located at 8712 County Road 878, Princeton, TX 75407 and is currently estimated at $359,902, approximately $213 per square foot. 8712 County Road 878 is a home located in Collin County with nearby schools including Harper Elementary School and Princeton High School.
Ownership History
Date
Name
Owned For
Owner Type
Purchase Details
Closed on
Jun 28, 2024
Sold by
Roy Amber Lynn
Bought by
Roy Randall Dwayne and Roy Randy
Current Estimated Value
Purchase Details
Closed on
May 27, 2020
Sold by
Roy Randall D and Roy Randall
Bought by
Roy Randall D and Roy Amber Lynn
Home Financials for this Owner
Home Financials are based on the most recent Mortgage that was taken out on this home.
Original Mortgage
$41,200
Interest Rate
3.3%
Mortgage Type
New Conventional
Purchase Details
Closed on
Nov 11, 2005
Sold by
Roy Rachell Lynn
Bought by
Roy Randall D
Purchase Details
Closed on
Aug 20, 1999
Sold by
Self Kevin L and Self Bridget L
Bought by
Roy Randall
Home Financials for this Owner
Home Financials are based on the most recent Mortgage that was taken out on this home.
Original Mortgage
$66,400
Interest Rate
7.68%
Create a Home Valuation Report for This Property
The Home Valuation Report is an in-depth analysis detailing your home's value as well as a comparison with similar homes in the area
Home Values in the Area
Average Home Value in this Area
Purchase History
| Date | Buyer | Sale Price | Title Company |
|---|---|---|---|
| Roy Randall Dwayne | -- | None Listed On Document | |
| Roy Randall D | -- | Nttx | |
| Roy Randall D | -- | None Available | |
| Roy Randall | -- | -- |
Source: Public Records
Mortgage History
| Date | Status | Borrower | Loan Amount |
|---|---|---|---|
| Previous Owner | Roy Randall D | $41,200 | |
| Previous Owner | Roy Randall | $66,400 | |
| Closed | Roy Randall D | $0 |
Source: Public Records
Tax History Compared to Growth
Tax History
| Year | Tax Paid | Tax Assessment Tax Assessment Total Assessment is a certain percentage of the fair market value that is determined by local assessors to be the total taxable value of land and additions on the property. | Land | Improvement |
|---|---|---|---|---|
| 2025 | $1,530 | $211,470 | $176,341 | $142,473 |
| 2024 | $1,530 | $192,245 | $176,341 | $122,323 |
| 2023 | $1,530 | $174,768 | $153,340 | $110,075 |
| 2022 | $2,664 | $158,880 | $107,338 | $97,642 |
| 2021 | $2,469 | $173,037 | $84,337 | $88,700 |
| 2020 | $2,396 | $131,305 | $42,935 | $88,370 |
| 2019 | $2,382 | $126,556 | $38,335 | $88,221 |
| 2018 | $2,425 | $128,158 | $38,335 | $103,971 |
| 2017 | $2,204 | $117,075 | $38,335 | $78,740 |
| 2016 | $2,023 | $105,915 | $38,335 | $67,580 |
| 2015 | $1,605 | $101,774 | $38,335 | $63,439 |
Source: Public Records
Map
Nearby Homes
- 3077 Pecan Ct
- 409 Bluegrass Way
- 113 Nathan Dr
- 209 Michael Dr
- Brookeview Plan at Morning Ridge
- Ivery Plan at Morning Ridge
- Galena Plan at Morning Ridge
- Aspen Plan at Morning Ridge
- Hamilton Plan at Morning Ridge
- Avery Plan at Morning Ridge
- Englewood Plan at Morning Ridge
- Evergreen Plan at Morning Ridge
- Oakridge Plan at Morning Ridge
- 1818 Christina Dr
- 208 Michael Dr
- 107 Abraham Ct
- 1816 Christina Dr
- 204 Michael Dr
- 202 Michael Dr
- 1814 Christina Dr
- 8640 County Road 878
- 8772 County Road 878
- 8789 County Road 878
- 2873 County Road 447
- 2892 County Road 447
- 8642 County Road 879
- 2816 County Road 447
- 2782 County Road 447
- 8690 County Road 879
- 2740 County Road 447
- 8895 County Road 392
- 8907 County Road 392
- 8514 County Road 879
- 8575 County Road 879
- 2708 County Road 447
- 8839 County Road 392
- 8665 County Road 879
- 2857 County Road 914
- 8943 County Road 392
- 2897 County Road 914