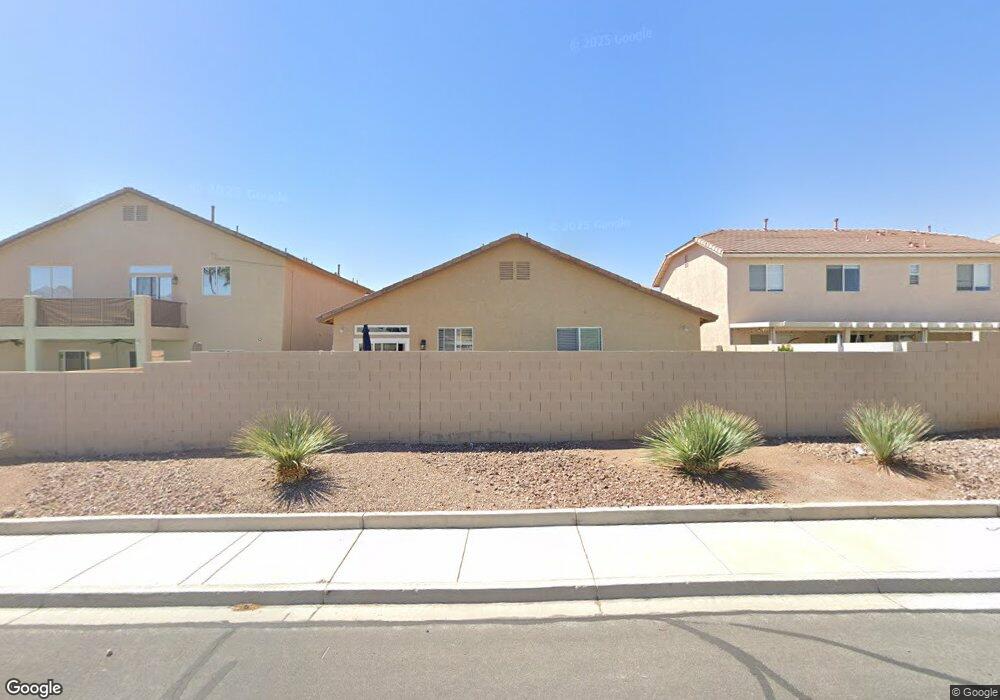
8712 Honey Vine Ave Unit 1 Las Vegas, NV 89143
Estimated Value: $381,000 - $431,000
3
Beds
2
Baths
1,482
Sq Ft
$274/Sq Ft
Est. Value
About This Home
This home is located at 8712 Honey Vine Ave Unit 1, Las Vegas, NV 89143 and is currently estimated at $405,960, approximately $273 per square foot. 8712 Honey Vine Ave Unit 1 is a home located in Clark County with nearby schools including James Bilbray Elementary School, William & Mary Scherkenbach Elementary School, and Ralph Cadwallader Middle School.
Ownership History
Date
Name
Owned For
Owner Type
Purchase Details
Closed on
May 25, 2023
Sold by
Cymerman Gary J
Bought by
Gary J Cymerman Revocable Living Trust
Current Estimated Value
Purchase Details
Closed on
Aug 12, 2002
Sold by
Raucci Patricia M and Raucci Thomas J
Bought by
Cymerman Gary J
Home Financials for this Owner
Home Financials are based on the most recent Mortgage that was taken out on this home.
Original Mortgage
$148,200
Interest Rate
6.16%
Purchase Details
Closed on
Dec 28, 1999
Sold by
Astoria Trails South Llc
Bought by
Raucci Thomas J and Raucci Patricia M
Home Financials for this Owner
Home Financials are based on the most recent Mortgage that was taken out on this home.
Original Mortgage
$131,567
Interest Rate
7.68%
Mortgage Type
FHA
Create a Home Valuation Report for This Property
The Home Valuation Report is an in-depth analysis detailing your home's value as well as a comparison with similar homes in the area
Home Values in the Area
Average Home Value in this Area
Purchase History
| Date | Buyer | Sale Price | Title Company |
|---|---|---|---|
| Gary J Cymerman Revocable Living Trust | -- | None Listed On Document | |
| Cymerman Gary J | $156,000 | First American Title Co | |
| Raucci Thomas J | $133,000 | First American Title Co |
Source: Public Records
Mortgage History
| Date | Status | Borrower | Loan Amount |
|---|---|---|---|
| Previous Owner | Cymerman Gary J | $148,200 | |
| Previous Owner | Raucci Thomas J | $131,567 |
Source: Public Records
Tax History Compared to Growth
Tax History
| Year | Tax Paid | Tax Assessment Tax Assessment Total Assessment is a certain percentage of the fair market value that is determined by local assessors to be the total taxable value of land and additions on the property. | Land | Improvement |
|---|---|---|---|---|
| 2025 | $1,832 | $103,562 | $32,900 | $70,662 |
| 2024 | $1,779 | $103,562 | $32,900 | $70,662 |
| 2023 | $1,779 | $101,142 | $34,650 | $66,492 |
| 2022 | $1,727 | $90,424 | $29,400 | $61,024 |
| 2021 | $1,677 | $82,127 | $24,150 | $57,977 |
| 2020 | $1,625 | $81,392 | $23,800 | $57,592 |
| 2019 | $1,578 | $79,197 | $22,400 | $56,797 |
| 2018 | $1,532 | $72,557 | $17,850 | $54,707 |
| 2017 | $2,359 | $71,947 | $16,450 | $55,497 |
| 2016 | $1,452 | $58,718 | $13,300 | $45,418 |
| 2015 | $1,448 | $46,993 | $9,800 | $37,193 |
| 2014 | $1,406 | $41,603 | $8,750 | $32,853 |
Source: Public Records
Map
Nearby Homes
- 8708 Honey Vine Ave
- 8625 Wild Diamond Ave
- 8728 Burning Hide Ave Unit 1
- 8020 Copperhead Creek St
- 8920 Iron Hitch Ave
- 8908 Happy Stream Ave
- 8833 Spinning Wheel Ave
- 8108 Terracotta Gulf Ct
- 7948 Quick Pine St
- 8021 Dancing Springs St
- 7864 Nesting Pine Place
- 9029 Tumblewood Ave
- 7909 Hollow Pine St Unit 2
- 8421 Cheerful Brook Ave
- 9053 Starling Wing Place
- 9065 Starling Wing Place Unit 91
- 8301 Strawberry Spring St
- 7957 Lovely Pine Place
- 8241 Harvest Spring Place
- 8225 Dusty Valley Ct
- 8716 Honey Vine Ave
- 8720 Honey Vine Ave
- 8704 Honey Vine Ave
- 8724 Honey Vine Ave
- 8700 Honey Vine Ave
- 8124 Jade Harbor Ct
- 8121 Jade Harbor Ct
- 8725 Honey Vine Ave
- 8709 Wild Diamond Ave
- 8713 Wild Diamond Ave
- 8120 Jade Harbor Ct
- 8705 Wild Diamond Ave
- 8652 Honey Vine Ave
- 8117 Jade Harbor Ct
- 8717 Wild Diamond Ave
- 8729 Honey Vine Ave
- 8701 Wild Diamond Ave
- 8125 Harbor Grey Ct
- 8116 Jade Harbor Ct