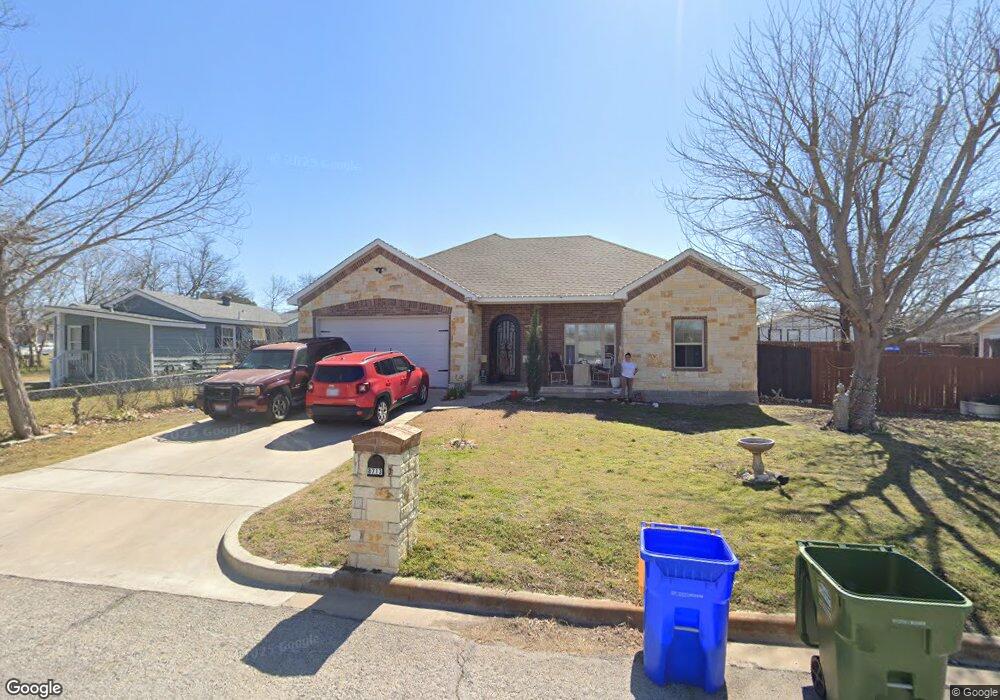
8713 Ronnie St Fort Worth, TX 76108
Estimated Value: $268,000 - $282,000
2
Beds
1
Bath
1,464
Sq Ft
$189/Sq Ft
Est. Value
About This Home
This home is located at 8713 Ronnie St, Fort Worth, TX 76108 and is currently estimated at $276,345, approximately $188 per square foot. 8713 Ronnie St is a home located in Tarrant County with nearby schools including West Elementary School, Brewer Middle School, and Tannahill Intermediate School.
Ownership History
Date
Name
Owned For
Owner Type
Purchase Details
Closed on
Jan 7, 2019
Sold by
Arroyo Petra
Bought by
Arroyo-Benitez Miguel
Current Estimated Value
Home Financials for this Owner
Home Financials are based on the most recent Mortgage that was taken out on this home.
Original Mortgage
$184,300
Outstanding Balance
$162,688
Interest Rate
4.8%
Mortgage Type
Purchase Money Mortgage
Estimated Equity
$113,657
Purchase Details
Closed on
Jan 25, 2018
Sold by
Barnett Billy J
Bought by
Arroyo Petra
Purchase Details
Closed on
Jan 15, 2016
Sold by
Delrio Salvador and Delrio Del Rio
Bought by
Barnett Billy J
Home Financials for this Owner
Home Financials are based on the most recent Mortgage that was taken out on this home.
Original Mortgage
$48,040
Interest Rate
3.98%
Mortgage Type
Purchase Money Mortgage
Purchase Details
Closed on
Sep 29, 2005
Sold by
Nevil Wayne L and Nevil Wanda L
Bought by
Salvador Delrio Jr and Salvador Del Rio
Create a Home Valuation Report for This Property
The Home Valuation Report is an in-depth analysis detailing your home's value as well as a comparison with similar homes in the area
Home Values in the Area
Average Home Value in this Area
Purchase History
| Date | Buyer | Sale Price | Title Company |
|---|---|---|---|
| Arroyo-Benitez Miguel | -- | None Available | |
| Arroyo Petra | -- | None Available | |
| Barnett Billy J | -- | Rattikin Title Company | |
| Salvador Delrio Jr | -- | -- |
Source: Public Records
Mortgage History
| Date | Status | Borrower | Loan Amount |
|---|---|---|---|
| Open | Arroyo-Benitez Miguel | $184,300 | |
| Previous Owner | Barnett Billy J | $48,040 |
Source: Public Records
Tax History Compared to Growth
Tax History
| Year | Tax Paid | Tax Assessment Tax Assessment Total Assessment is a certain percentage of the fair market value that is determined by local assessors to be the total taxable value of land and additions on the property. | Land | Improvement |
|---|---|---|---|---|
| 2025 | $7,128 | $300,868 | $50,847 | $250,021 |
| 2024 | $7,128 | $300,868 | $50,847 | $250,021 |
| 2023 | $7,028 | $295,590 | $50,847 | $244,743 |
| 2022 | $6,313 | $233,112 | $25,000 | $208,112 |
| 2021 | $6,053 | $220,056 | $25,000 | $195,056 |
| 2020 | $5,192 | $187,363 | $25,000 | $162,363 |
| 2019 | $5,156 | $179,240 | $25,000 | $154,240 |
| 2018 | $345 | $12,000 | $12,000 | $0 |
| 2017 | $351 | $12,000 | $12,000 | $0 |
| 2016 | $351 | $12,000 | $12,000 | $0 |
| 2015 | $632 | $12,000 | $12,000 | $0 |
| 2014 | $632 | $22,000 | $12,400 | $9,600 |
Source: Public Records
Map
Nearby Homes
- 308 Hallvale Dr
- 304 Lockwood St
- 201 N Normandale St
- 8814 Clifford St
- 105 Lockwood St
- 203 East Place
- 8401 Clifford St
- 204 Lanham Ct
- 9104 White Settlement Rd
- 8321 Raymond Ave
- 7945 White Settlement Rd
- 8402 Melrose St W
- 311 Russell St
- 627 Hallvale Dr
- 9201 Clifford St
- 9005 Glenn Dr
- 8814 Rockway St
- 9200 Farmers Rd
- 9221 White Settlement Rd
- 405 S Las Vegas Trail
- 308 N Las Vegas Trail
- 8711 Ronnie St
- 8717 Ronnie St
- 313 Hallvale Dr
- 8707 Ronnie St
- 309 Hallvale Dr
- 8708 Raymond Ave
- 400 N Las Vegas Trail
- 8712 Raymond Ave
- 8704 Raymond Ave
- 305 Hallvale Dr
- 8708 Ronnie St
- 8712 Ronnie St
- 401 Hallvale Dr
- 312 Hallvale Dr
- 8700 Raymond Ave
- 408 N Las Vegas Trail
- 8616 Ronnie St
- 8615 Ronnie St
- 415 Hallvale Dr