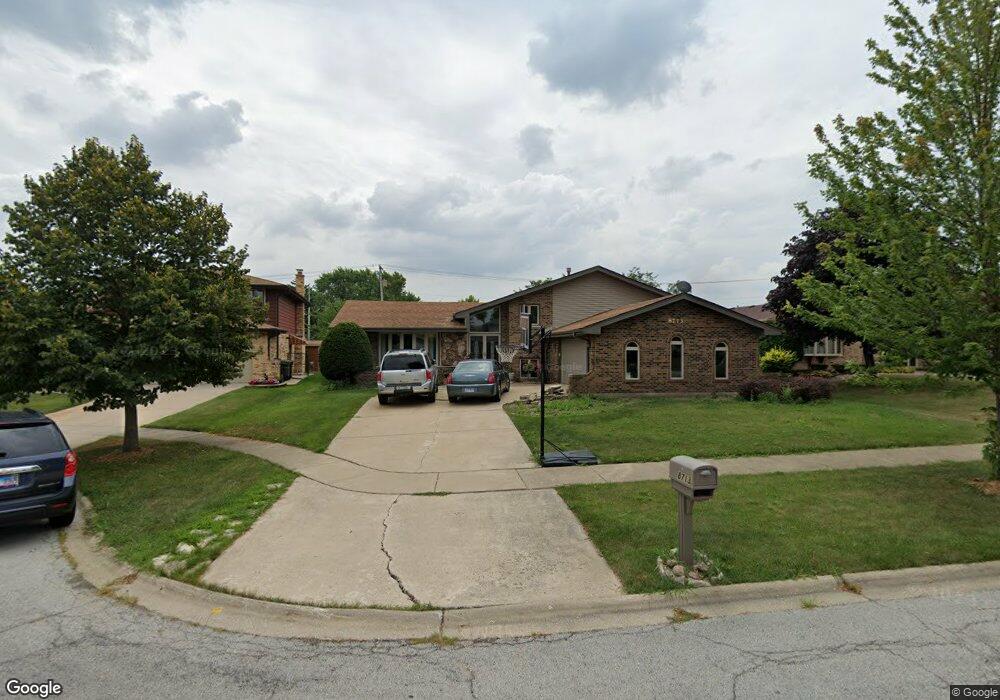
8713 Trent Ct Tinley Park, IL 60487
Central Tinley Park NeighborhoodEstimated Value: $403,000 - $481,000
5
Beds
3
Baths
2,000
Sq Ft
$216/Sq Ft
Est. Value
About This Home
This home is located at 8713 Trent Ct, Tinley Park, IL 60487 and is currently estimated at $432,579, approximately $216 per square foot. 8713 Trent Ct is a home located in Cook County with nearby schools including Christa Mcauliffe School, Prairie View Middle School, and Victor J Andrew High School.
Ownership History
Date
Name
Owned For
Owner Type
Purchase Details
Closed on
Oct 22, 2016
Sold by
Mustafa Amjad and Harb Mustafa Arwa M
Bought by
Mustafa Amjad and Harb Mustafa Arwa M
Current Estimated Value
Purchase Details
Closed on
Jan 21, 2015
Sold by
Abdelhamid Iyad Ali
Bought by
Abdelhamid Iyad Ali and Mustafa Amjad
Purchase Details
Closed on
Oct 22, 2012
Sold by
Iyad Mustafa Amjad and Iyad Abdelhamidas
Bought by
Abdelhamid Iyad Ali
Purchase Details
Closed on
Nov 30, 2011
Sold by
Mustafa Amjad
Bought by
Mustafa Amjad and Abdelhamid Iyad
Purchase Details
Closed on
Aug 27, 2008
Sold by
Throw Alfred and Throw Diana
Bought by
Mustafa Amjad
Home Financials for this Owner
Home Financials are based on the most recent Mortgage that was taken out on this home.
Original Mortgage
$175,000
Interest Rate
6.55%
Mortgage Type
Unknown
Create a Home Valuation Report for This Property
The Home Valuation Report is an in-depth analysis detailing your home's value as well as a comparison with similar homes in the area
Home Values in the Area
Average Home Value in this Area
Purchase History
| Date | Buyer | Sale Price | Title Company |
|---|---|---|---|
| Mustafa Amjad | -- | Attorney | |
| Abdelhamid Iyad Ali | -- | None Available | |
| Abdelhamid Iyad Ali | -- | None Available | |
| Mustafa Amjad | -- | None Available | |
| Mustafa Amjad | $250,000 | Attorneys Title Guaranty Fun |
Source: Public Records
Mortgage History
| Date | Status | Borrower | Loan Amount |
|---|---|---|---|
| Previous Owner | Mustafa Amjad | $175,000 |
Source: Public Records
Tax History Compared to Growth
Tax History
| Year | Tax Paid | Tax Assessment Tax Assessment Total Assessment is a certain percentage of the fair market value that is determined by local assessors to be the total taxable value of land and additions on the property. | Land | Improvement |
|---|---|---|---|---|
| 2024 | $8,519 | $31,945 | $5,376 | $26,569 |
| 2023 | $6,348 | $34,000 | $5,376 | $28,624 |
| 2022 | $6,348 | $21,227 | $4,675 | $16,552 |
| 2021 | $6,175 | $21,226 | $4,674 | $16,552 |
| 2020 | $6,091 | $21,226 | $4,674 | $16,552 |
| 2019 | $6,606 | $23,797 | $4,207 | $19,590 |
| 2018 | $6,717 | $24,601 | $4,207 | $20,394 |
| 2017 | $7,600 | $24,601 | $4,207 | $20,394 |
| 2016 | $7,573 | $22,803 | $3,739 | $19,064 |
| 2015 | $7,492 | $22,803 | $3,739 | $19,064 |
| 2014 | $7,428 | $22,803 | $3,739 | $19,064 |
| 2013 | $7,105 | $23,525 | $3,739 | $19,786 |
Source: Public Records
Map
Nearby Homes
- Fremont Plan at Radcliffe Place
- Calysta Plan at Radcliffe Place
- Danbury Plan at Radcliffe Place
- Briarcliffe Plan at Radcliffe Place
- Eden Plan at Radcliffe Place
- Amberwood Plan at Radcliffe Place
- 17324 Humber Ln
- 17631 Dover Ct
- 8543 Carriage Ln
- 8548 Bethany Ln
- 17230 Shetland Dr
- 17533 Pecan Ln
- 8313 Aster Ln
- 17155 Kamp Ct Unit 9
- 8456 170th Place
- 9201 175th St
- 8444 W 171st St
- 8721 W 169th St
- 9260 Windsor Pkwy Unit 80
- 9280 Windsor Pkwy Unit 92