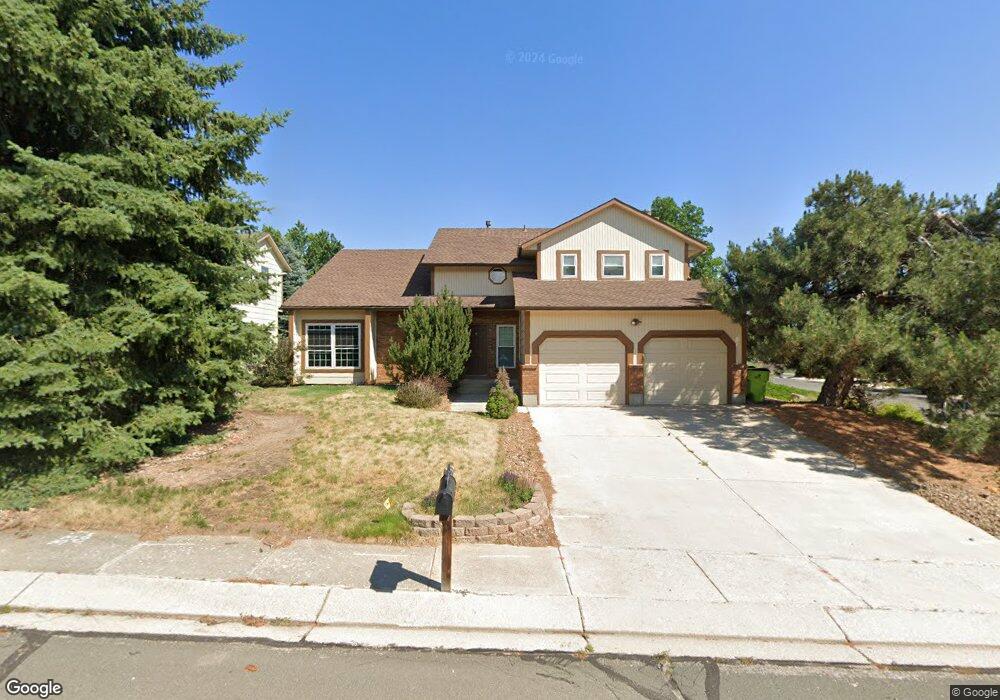
8715 Hillsport Way Colorado Springs, CO 80920
Briargate NeighborhoodEstimated Value: $603,045 - $623,000
5
Beds
3
Baths
2,292
Sq Ft
$267/Sq Ft
Est. Value
About This Home
This home is located at 8715 Hillsport Way, Colorado Springs, CO 80920 and is currently estimated at $612,261, approximately $267 per square foot. 8715 Hillsport Way is a home located in El Paso County with nearby schools including High Plains Elementary School, Mountain Ridge Middle School, and Rampart High School.
Ownership History
Date
Name
Owned For
Owner Type
Purchase Details
Closed on
Jun 17, 2021
Sold by
Bowers Craig M and Bowers Michelle L
Bought by
Lee Michael D and Lee Kayla
Current Estimated Value
Home Financials for this Owner
Home Financials are based on the most recent Mortgage that was taken out on this home.
Original Mortgage
$481,650
Outstanding Balance
$436,074
Interest Rate
2.9%
Mortgage Type
VA
Estimated Equity
$176,187
Purchase Details
Closed on
Jan 25, 2007
Sold by
Bowers Craig M and Colella Michelle L
Bought by
Bowers Craig M and Bowers Michelle L
Purchase Details
Closed on
Mar 14, 2006
Sold by
Thorson Bruce A and Thorson Cheryl D
Bought by
Bowers Craig M and Colella Michelle L
Home Financials for this Owner
Home Financials are based on the most recent Mortgage that was taken out on this home.
Original Mortgage
$239,600
Interest Rate
6.19%
Mortgage Type
Fannie Mae Freddie Mac
Purchase Details
Closed on
Jun 1, 1986
Bought by
Bowers Craig M
Purchase Details
Closed on
Jul 1, 1985
Bought by
Bowers Michelle L
Create a Home Valuation Report for This Property
The Home Valuation Report is an in-depth analysis detailing your home's value as well as a comparison with similar homes in the area
Home Values in the Area
Average Home Value in this Area
Purchase History
| Date | Buyer | Sale Price | Title Company |
|---|---|---|---|
| Lee Michael D | $560,000 | Wfg National Title | |
| Bowers Craig M | -- | None Available | |
| Bowers Craig M | $299,500 | Peoples National Title | |
| Bowers Craig M | -- | -- | |
| Bowers Michelle L | -- | -- |
Source: Public Records
Mortgage History
| Date | Status | Borrower | Loan Amount |
|---|---|---|---|
| Open | Lee Michael D | $481,650 | |
| Previous Owner | Bowers Craig M | $239,600 |
Source: Public Records
Tax History Compared to Growth
Tax History
| Year | Tax Paid | Tax Assessment Tax Assessment Total Assessment is a certain percentage of the fair market value that is determined by local assessors to be the total taxable value of land and additions on the property. | Land | Improvement |
|---|---|---|---|---|
| 2025 | $2,364 | $39,190 | -- | -- |
| 2024 | $2,334 | $40,520 | $5,360 | $35,160 |
| 2022 | $1,986 | $28,140 | $4,340 | $23,800 |
| 2021 | $2,196 | $28,950 | $4,460 | $24,490 |
| 2020 | $2,057 | $25,270 | $3,720 | $21,550 |
| 2019 | $2,036 | $25,270 | $3,720 | $21,550 |
| 2018 | $1,810 | $22,100 | $2,880 | $19,220 |
| 2017 | $1,804 | $22,100 | $2,880 | $19,220 |
| 2016 | $1,999 | $24,460 | $2,930 | $21,530 |
| 2015 | $1,995 | $24,460 | $2,930 | $21,530 |
| 2014 | $1,849 | $22,650 | $2,930 | $19,720 |
Source: Public Records
Map
Nearby Homes
- 2730 Kenton Green Ct
- 8735 Chapel Square Ct
- 2644 Marston Heights
- 2340 Winstead View
- 2560 Wimbleton Ct
- 2656 Marston Heights
- 2270 Cloverdale Dr
- 8335 Sutterfield Dr
- 2715 Heathrow Dr
- 2430 Linenhall Ct
- 8935 Coberdale Ct
- 2130 Wimbleton Ct
- 1931 London Carriage Grove
- 8161 Regiment Ct
- 8135 Portsmouth Ct
- 2114 Summerset Dr
- 2006 Summerset Dr
- 3142 Soaring Bird Cir
- 9659 Carriage Creek Point
- 8213 Caravel Dr
- 8725 Hillsport Way
- 2680 Norwich Dr
- 2660 Norwich Dr
- 2675 Norwich Dr
- 2685 Norwich Dr
- 8735 Hillsport Way
- 2690 Norwich Dr
- 8720 Turnbridge Place
- 2665 Norwich Dr
- 8730 Turnbridge Place
- 2695 Norwich Dr
- 8710 Turnbridge Place
- 2650 Norwich Dr
- 8740 Hillsport Way
- 8730 Hillsport Way
- 2655 Norwich Dr
- 8740 Turnbridge Place
- 8720 Hillsport Way
- 2374 Thornhill Dr
- 2366 Thornhill Dr