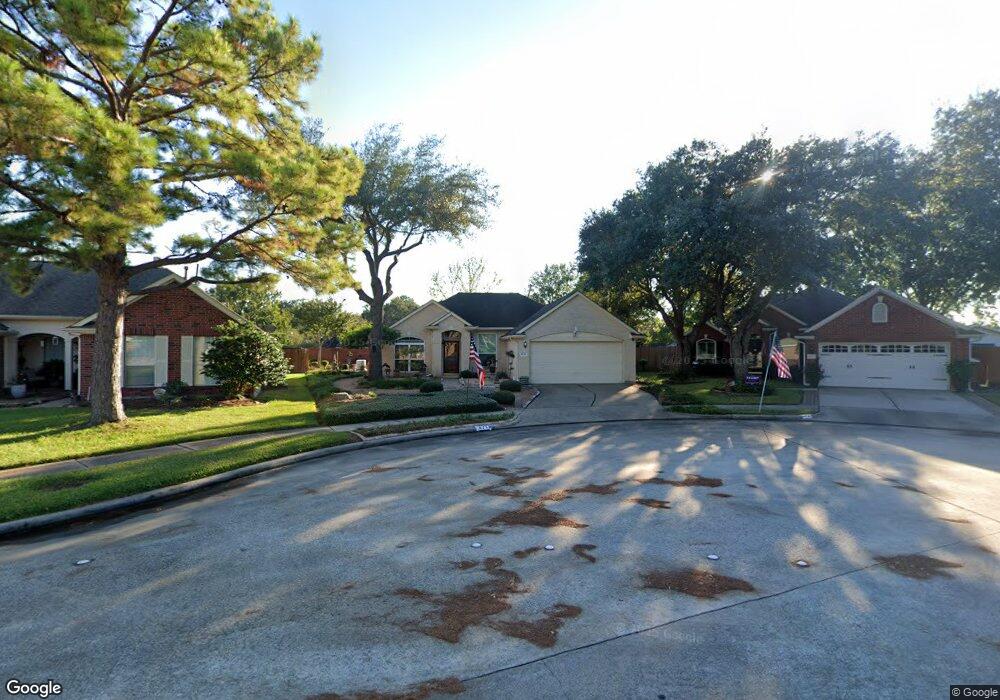
8719 Aberdeen Palms Dr Houston, TX 77095
Estimated Value: $267,053 - $321,000
3
Beds
2
Baths
1,612
Sq Ft
$181/Sq Ft
Est. Value
About This Home
This home is located at 8719 Aberdeen Palms Dr, Houston, TX 77095 and is currently estimated at $291,513, approximately $180 per square foot. 8719 Aberdeen Palms Dr is a home located in Harris County with nearby schools including Birkes Elementary School, Labay Middle School, and Cypress Falls High School.
Ownership History
Date
Name
Owned For
Owner Type
Purchase Details
Closed on
Feb 28, 2023
Sold by
Nelson Robert Clair and Mai Loan Thanh
Bought by
Robert Clair Nelson And Loan Thanh Mai Living
Current Estimated Value
Purchase Details
Closed on
Feb 17, 2010
Sold by
Timmermeyer David G
Bought by
Nelson Robert C and Mai Loan
Purchase Details
Closed on
Aug 14, 1998
Sold by
Altizer Jana H and Altizer Shawn P
Bought by
Timmermeyer David G
Home Financials for this Owner
Home Financials are based on the most recent Mortgage that was taken out on this home.
Original Mortgage
$83,600
Interest Rate
6.95%
Purchase Details
Closed on
Jul 25, 1995
Sold by
George Wimpey Of Texas Inc
Bought by
Altizer Shawn P and Altizer Jana H
Home Financials for this Owner
Home Financials are based on the most recent Mortgage that was taken out on this home.
Original Mortgage
$97,050
Interest Rate
8.41%
Create a Home Valuation Report for This Property
The Home Valuation Report is an in-depth analysis detailing your home's value as well as a comparison with similar homes in the area
Home Values in the Area
Average Home Value in this Area
Purchase History
| Date | Buyer | Sale Price | Title Company |
|---|---|---|---|
| Robert Clair Nelson And Loan Thanh Mai Living | -- | None Listed On Document | |
| Nelson Robert C | -- | Great American Title Company | |
| Timmermeyer David G | -- | Commonwealth Land Title Co | |
| Altizer Shawn P | -- | American Title |
Source: Public Records
Mortgage History
| Date | Status | Borrower | Loan Amount |
|---|---|---|---|
| Previous Owner | Timmermeyer David G | $83,600 | |
| Previous Owner | Altizer Shawn P | $97,050 |
Source: Public Records
Tax History Compared to Growth
Tax History
| Year | Tax Paid | Tax Assessment Tax Assessment Total Assessment is a certain percentage of the fair market value that is determined by local assessors to be the total taxable value of land and additions on the property. | Land | Improvement |
|---|---|---|---|---|
| 2025 | $1,465 | $263,619 | $65,546 | $198,073 |
| 2024 | $1,465 | $266,744 | $65,546 | $201,198 |
| 2023 | $1,465 | $238,732 | $65,546 | $173,186 |
| 2022 | $4,772 | $235,680 | $50,311 | $185,369 |
| 2021 | $4,591 | $177,206 | $50,311 | $126,895 |
| 2020 | $4,818 | $185,799 | $41,807 | $143,992 |
| 2019 | $4,512 | $162,260 | $29,761 | $132,499 |
| 2018 | $1,402 | $152,948 | $29,761 | $123,187 |
| 2017 | $4,277 | $152,948 | $29,761 | $123,187 |
| 2016 | $3,915 | $140,000 | $29,761 | $110,239 |
| 2015 | $2,924 | $140,000 | $29,761 | $110,239 |
| 2014 | $2,924 | $128,056 | $24,801 | $103,255 |
Source: Public Records
Map
Nearby Homes
- 16111 Aberdeen Forest Dr
- 16123 Aberdeen Forest Dr
- 8814 Sherina Park Dr
- 8550 Sparkling Springs Dr
- 8818 Apple Mill Dr
- 16211 Green Smoke Dr
- 15954 Oak Mountain Dr
- 8550 Waiting Spring Ln
- 8426 Laurel Trails Dr
- 15906 Marwick Ct
- 8306 Lake Crystal Dr
- 8835 Aberdeen Park Dr
- 15735 Jamie Lee Dr
- 8526 Hot Springs Dr
- 8806 Gas Light Village Dr
- 16403 Torry View Terrace
- 15802 Aberdeen Trails Dr
- 8526 Greenleaf Lake Dr
- 8619 Arranmore Ln
- 16426 Torry View Terrace
- 8715 Aberdeen Palms Dr
- 8723 Aberdeen Palms Dr
- 8727 Aberdeen Palms Dr
- 8711 Aberdeen Palms Dr
- 8731 Aberdeen Palms Dr
- 8730 Aberdeen Palms Dr
- 8707 Aberdeen Palms Dr
- 16114 Golden Sands Dr
- 16106 Golden Sands Dr
- 16118 Golden Sands Dr
- 8735 Aberdeen Palms Dr
- 8734 Aberdeen Palms Dr
- 16102 Golden Sands Dr
- 16122 Golden Sands Dr
- 8703 Aberdeen Palms Dr
- 16126 Golden Sands Dr
- 8739 Aberdeen Palms Dr
- 8710 Aberdeen Palms Dr
- 8738 Aberdeen Palms Dr
- 16130 Golden Sands Dr