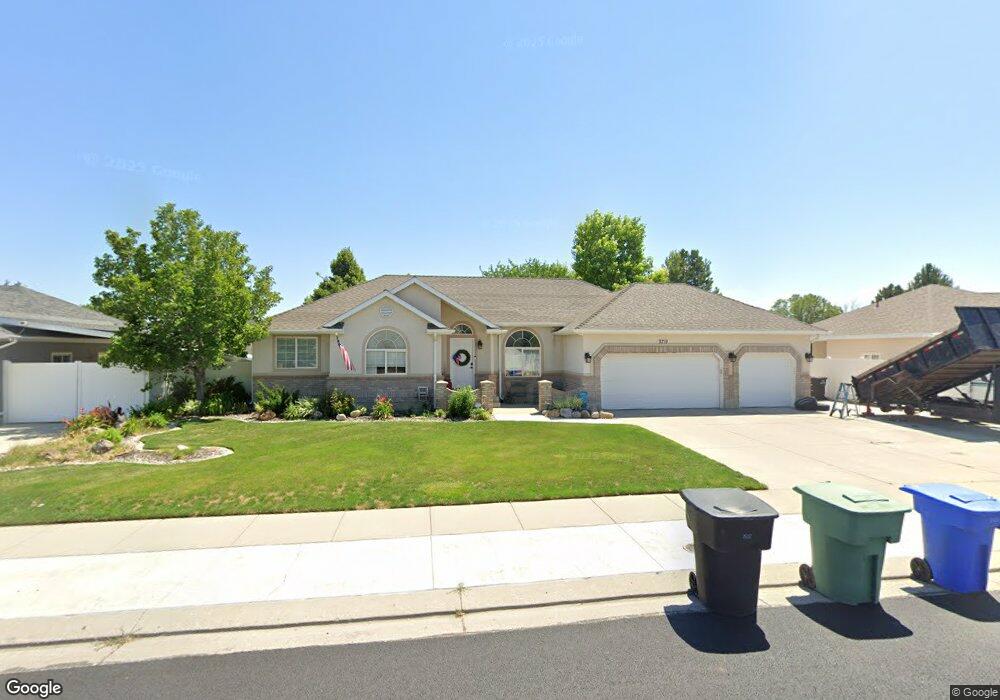
8719 Bingham View Dr West Jordan, UT 84088
Jordan Oaks NeighborhoodEstimated Value: $599,000 - $664,000
4
Beds
3
Baths
1,466
Sq Ft
$425/Sq Ft
Est. Value
About This Home
This home is located at 8719 Bingham View Dr, West Jordan, UT 84088 and is currently estimated at $622,590, approximately $424 per square foot. 8719 Bingham View Dr is a home located in Salt Lake County with nearby schools including Jordan Hills Elementary School, West Hills Middle School, and Copper Hills High School.
Ownership History
Date
Name
Owned For
Owner Type
Purchase Details
Closed on
Aug 18, 2014
Sold by
Olson Martin
Bought by
Olson Martin and Olson Amy Lynn
Current Estimated Value
Home Financials for this Owner
Home Financials are based on the most recent Mortgage that was taken out on this home.
Original Mortgage
$274,084
Outstanding Balance
$209,066
Interest Rate
4.12%
Mortgage Type
New Conventional
Estimated Equity
$413,524
Purchase Details
Closed on
Aug 28, 2013
Sold by
Tuttle Paul A and Tuttle Laury A
Bought by
Olson Martin
Home Financials for this Owner
Home Financials are based on the most recent Mortgage that was taken out on this home.
Original Mortgage
$265,010
Interest Rate
4.25%
Mortgage Type
FHA
Purchase Details
Closed on
Oct 16, 1997
Sold by
Building Dynamics Inc
Bought by
Tuttle Paul A and Tuttle Laury A
Home Financials for this Owner
Home Financials are based on the most recent Mortgage that was taken out on this home.
Original Mortgage
$131,550
Interest Rate
7.49%
Create a Home Valuation Report for This Property
The Home Valuation Report is an in-depth analysis detailing your home's value as well as a comparison with similar homes in the area
Home Values in the Area
Average Home Value in this Area
Purchase History
| Date | Buyer | Sale Price | Title Company |
|---|---|---|---|
| Olson Martin | -- | Accommodation | |
| Olson Martin | -- | Title Guarantee | |
| Olson Martin | -- | First American Title | |
| Tuttle Paul A | -- | -- |
Source: Public Records
Mortgage History
| Date | Status | Borrower | Loan Amount |
|---|---|---|---|
| Open | Olson Martin | $274,084 | |
| Closed | Olson Martin | $265,010 | |
| Previous Owner | Tuttle Paul A | $131,550 |
Source: Public Records
Tax History Compared to Growth
Tax History
| Year | Tax Paid | Tax Assessment Tax Assessment Total Assessment is a certain percentage of the fair market value that is determined by local assessors to be the total taxable value of land and additions on the property. | Land | Improvement |
|---|---|---|---|---|
| 2025 | $2,986 | $579,600 | $184,500 | $395,100 |
| 2024 | $2,986 | $574,600 | $182,700 | $391,900 |
| 2023 | $3,011 | $545,900 | $172,300 | $373,600 |
| 2022 | $3,047 | $543,500 | $169,000 | $374,500 |
| 2021 | $2,574 | $418,000 | $131,300 | $286,700 |
| 2020 | $2,411 | $367,400 | $131,300 | $236,100 |
| 2019 | $2,374 | $354,800 | $123,900 | $230,900 |
| 2018 | $2,251 | $333,600 | $123,900 | $209,700 |
| 2017 | $2,089 | $308,300 | $123,900 | $184,400 |
| 2016 | $2,016 | $279,500 | $123,900 | $155,600 |
| 2015 | $2,092 | $282,800 | $131,000 | $151,800 |
| 2014 | $1,932 | $257,100 | $120,400 | $136,700 |
Source: Public Records
Map
Nearby Homes
- 4624 Pine Crossing Dr
- 8941 S Sun Leaf Dr
- 8359 Etude Dr
- 4887 W 8620 S
- 3931 W Dansere Cir
- 8400 S 4000 W Unit 134
- 7903 Mckenzie Ln
- 7886 Mckenzie Ln
- 3888 W 8700 S
- 9353 S 4460 W
- 8577 Autumn Gold Cir
- 4904 Wild Acres Dr
- 5098 Cherry Laurel Ln
- 3977 W Elwood Way
- 8322 Copper Vista Cir
- 9375 S Laurel Ridge Cir
- 7973 S Nebo Dr
- 4678 Emmons Dr
- 9332 S Wild Clover Ln
- 4565 Lennox Dr
- 8733 Bingham View Dr
- 8733 S Bingham View Dr
- 8707 Bingham View Dr
- 8714 Copper Pot Ln
- 8698 Copper Pot Ln
- 8691 S Bingham View Dr
- 8691 Bingham View Dr
- 4483 Copper Valley Ln
- 8747 Bingham View Dr
- 8747 S Bingham View Dr
- 4444 Copper Glen Ct
- 4428 Copper Glen Ct
- 4482 Bingham View Cir
- 4482 W Bingham View Cir
- 8682 Copper Pot Ln
- 4439 Copper Pot Ln
- 4488 Copper Valley Ln
- 4463 W Copper Pot Ln
- 4463 Copper Pot Ln
- 8763 Bingham View Dr