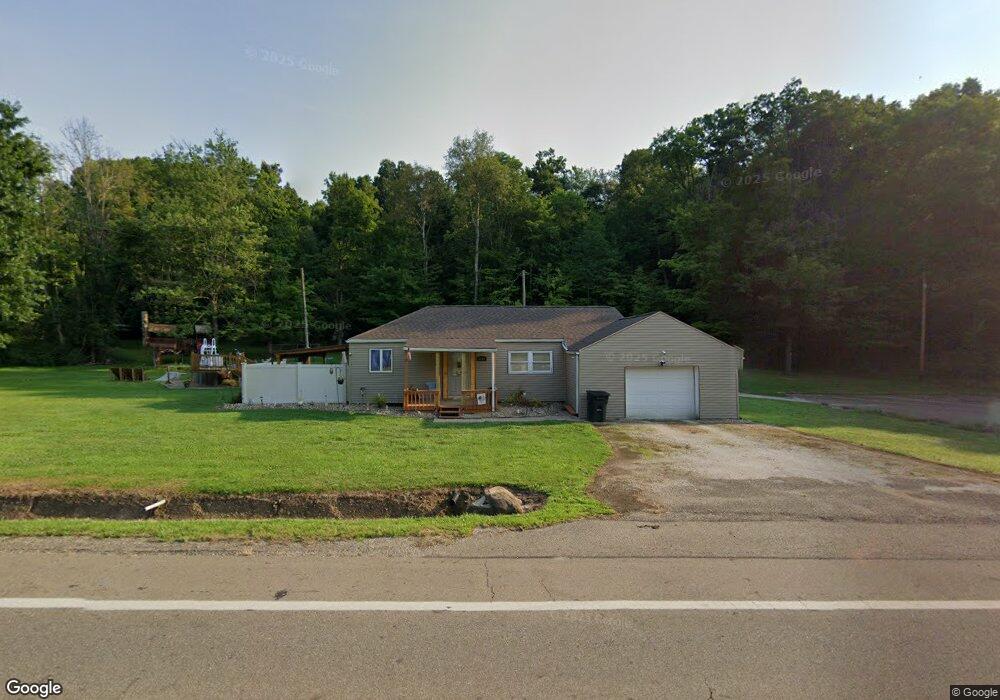
8719 Lincoln St SE East Canton, OH 44730
Estimated Value: $149,000 - $192,177
2
Beds
1
Bath
1,124
Sq Ft
$156/Sq Ft
Est. Value
About This Home
This home is located at 8719 Lincoln St SE, East Canton, OH 44730 and is currently estimated at $175,794, approximately $156 per square foot. 8719 Lincoln St SE is a home located in Stark County with nearby schools including East Canton Elementary School, East Canton Middle School, and East Canton High School.
Ownership History
Date
Name
Owned For
Owner Type
Purchase Details
Closed on
Mar 30, 2015
Sold by
Halsey Eric S and Halsey Tami
Bought by
Johns Rodney C and Johns Peggy L
Current Estimated Value
Home Financials for this Owner
Home Financials are based on the most recent Mortgage that was taken out on this home.
Original Mortgage
$91,803
Outstanding Balance
$71,635
Interest Rate
4.12%
Mortgage Type
FHA
Estimated Equity
$104,159
Purchase Details
Closed on
Feb 22, 2006
Sold by
Neiswanger Ralph H and Neiswanger Kathy J
Bought by
Halsey Eric S
Purchase Details
Closed on
May 8, 1996
Sold by
Shuman John C
Bought by
Neiswanger Ralph H and Neiswanger Kathy
Home Financials for this Owner
Home Financials are based on the most recent Mortgage that was taken out on this home.
Original Mortgage
$64,600
Interest Rate
7.78%
Mortgage Type
FHA
Purchase Details
Closed on
May 5, 1994
Purchase Details
Closed on
Mar 11, 1992
Create a Home Valuation Report for This Property
The Home Valuation Report is an in-depth analysis detailing your home's value as well as a comparison with similar homes in the area
Home Values in the Area
Average Home Value in this Area
Purchase History
| Date | Buyer | Sale Price | Title Company |
|---|---|---|---|
| Johns Rodney C | $93,500 | Title Source Inc | |
| Halsey Eric S | $61,000 | None Available | |
| Neiswanger Ralph H | $64,500 | -- | |
| -- | -- | -- | |
| -- | $39,700 | -- |
Source: Public Records
Mortgage History
| Date | Status | Borrower | Loan Amount |
|---|---|---|---|
| Open | Johns Rodney C | $91,803 | |
| Previous Owner | Neiswanger Ralph H | $64,600 |
Source: Public Records
Tax History Compared to Growth
Tax History
| Year | Tax Paid | Tax Assessment Tax Assessment Total Assessment is a certain percentage of the fair market value that is determined by local assessors to be the total taxable value of land and additions on the property. | Land | Improvement |
|---|---|---|---|---|
| 2025 | -- | $44,800 | $16,170 | $28,630 |
| 2024 | -- | $44,800 | $16,170 | $28,630 |
| 2023 | $1,304 | $34,620 | $10,710 | $23,910 |
| 2022 | $1,277 | $34,620 | $10,710 | $23,910 |
| 2021 | $1,281 | $34,620 | $10,710 | $23,910 |
| 2020 | $1,302 | $32,030 | $9,800 | $22,230 |
| 2019 | $1,277 | $32,030 | $9,800 | $22,230 |
| 2018 | $1,265 | $32,030 | $9,800 | $22,230 |
| 2017 | $1,200 | $27,830 | $9,910 | $17,920 |
| 2016 | $1,158 | $26,680 | $9,910 | $16,770 |
| 2015 | $1,198 | $26,680 | $9,910 | $16,770 |
| 2014 | $1,130 | $22,930 | $8,510 | $14,420 |
| 2013 | $569 | $22,930 | $8,510 | $14,420 |
Source: Public Records
Map
Nearby Homes
- 2030 Woodland Park Ave SE
- 0 Neimans Ave SE Unit 5149957
- 7547 Lincoln St SE
- 0 Lincoln St SE Unit 5157308
- 0 Lincoln St SE Unit 5157344
- 0 Lincoln St SE Unit 5157290
- 1990 Belfort Ave
- 10400 Lincoln St SE
- 7205 Mapleton St SE
- 2079 Parks Ave SE
- 2425 Miday Ave NE
- 137 Noble St W
- 229 Liberty St W
- 223 Nassau St W
- 233 Nassau St W
- 8225 Georgetown St
- 225 - 227 Plum St N
- 615 Noble St W
- 6969 Georgetown St NE
- 3390 Meese Rd NE
- 8722 Lincoln St SE
- 1851 Woodland Park Ave SE
- 8674 Lincoln St SE
- 8781 Lincoln St SE
- 8679 Lincoln St SE
- 1879 Woodland Park Ave SE
- 1900 Woodland Park Ave SE
- 8843 Lincoln St SE
- 1836 Woodland Park Ave SE
- 1921 Woodland Park Ave SE
- 8862 Lincoln St SE
- 1834 Woodland Park Ave SE
- 8844 Cindell St SE
- 1911 Cloveridge Ave SE
- 8877 Lincoln St SE
- 1931 Cloveridge Ave SE
- 1950 Woodland Park Ave SE
- 1951 Cloveridge Ave SE
- 1966 Woodland Park Ave SE
- 1922 Cloveridge Ave SE