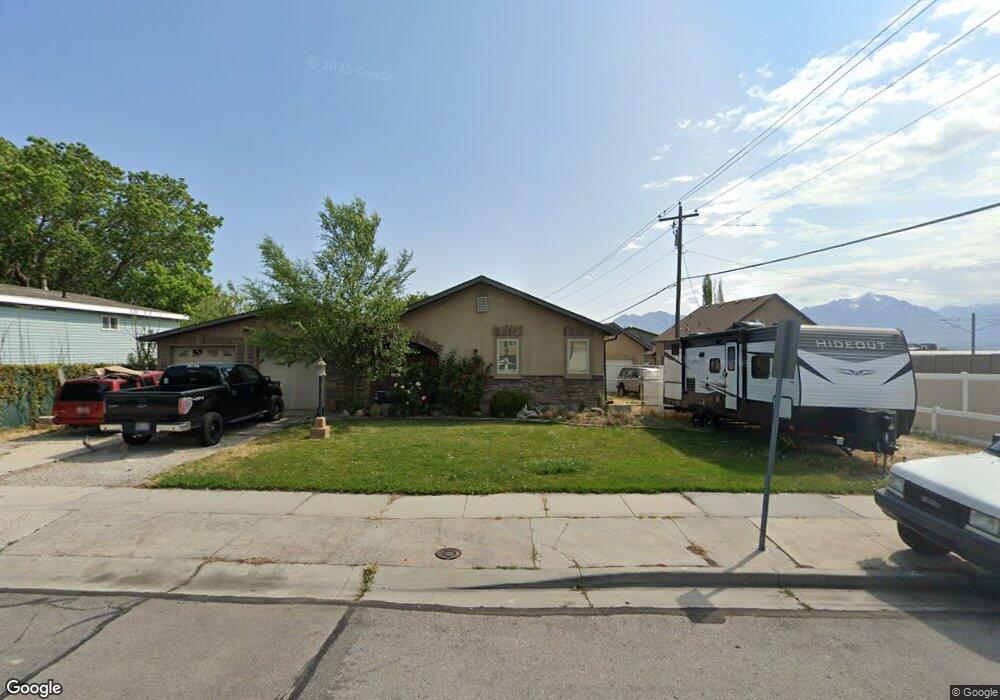
8719 Newell Dr West Jordan, UT 84088
Jordan Oaks NeighborhoodEstimated Value: $467,000 - $505,300
5
Beds
2
Baths
1,872
Sq Ft
$260/Sq Ft
Est. Value
About This Home
This home is located at 8719 Newell Dr, West Jordan, UT 84088 and is currently estimated at $486,075, approximately $259 per square foot. 8719 Newell Dr is a home located in Salt Lake County with nearby schools including Columbia Elementary School, Joel P. Jensen Middle School, and West Jordan High School.
Ownership History
Date
Name
Owned For
Owner Type
Purchase Details
Closed on
Sep 8, 2017
Sold by
Burgess Tad
Bought by
Peterson Jacob and Peterson Jalynn
Current Estimated Value
Home Financials for this Owner
Home Financials are based on the most recent Mortgage that was taken out on this home.
Original Mortgage
$274,928
Outstanding Balance
$229,399
Interest Rate
3.87%
Mortgage Type
FHA
Estimated Equity
$256,676
Purchase Details
Closed on
Dec 7, 2012
Sold by
Burgess Tad
Bought by
Burgess Tad
Home Financials for this Owner
Home Financials are based on the most recent Mortgage that was taken out on this home.
Original Mortgage
$152,625
Interest Rate
3.35%
Purchase Details
Closed on
Aug 25, 2010
Sold by
Beneficial Financial I Inc
Bought by
Burgess Tad
Home Financials for this Owner
Home Financials are based on the most recent Mortgage that was taken out on this home.
Original Mortgage
$154,913
Interest Rate
4.75%
Mortgage Type
FHA
Purchase Details
Closed on
Mar 23, 2010
Sold by
Snedeger Michael K and Yazzie Karlene
Bought by
Beneficial Utah Inc
Purchase Details
Closed on
Feb 8, 2007
Sold by
Snedeger Michael K
Bought by
Snedeger Michael K and Yazzie Karlene
Home Financials for this Owner
Home Financials are based on the most recent Mortgage that was taken out on this home.
Original Mortgage
$182,300
Interest Rate
8.7%
Purchase Details
Closed on
Feb 7, 2007
Sold by
Snedeger Michael K and Snedeger Michael J
Bought by
Snedeger Michael K
Home Financials for this Owner
Home Financials are based on the most recent Mortgage that was taken out on this home.
Original Mortgage
$182,300
Interest Rate
8.7%
Purchase Details
Closed on
Jan 25, 2006
Sold by
Snedeger Michael K
Bought by
Snedeger Michael K and Yazzie Karlene
Home Financials for this Owner
Home Financials are based on the most recent Mortgage that was taken out on this home.
Original Mortgage
$26,500
Interest Rate
6.16%
Mortgage Type
Stand Alone Second
Purchase Details
Closed on
Dec 27, 2004
Sold by
Mallari Christian B and Mallari Miraha Patawaran
Bought by
Mallari Christian B and Mallari Miraha Patawaran
Home Financials for this Owner
Home Financials are based on the most recent Mortgage that was taken out on this home.
Original Mortgage
$104,000
Interest Rate
5.74%
Purchase Details
Closed on
Apr 28, 2003
Sold by
Mallari Miraha Patawaran
Bought by
Mallari Christian B and Mallari Miraha Patawaran
Create a Home Valuation Report for This Property
The Home Valuation Report is an in-depth analysis detailing your home's value as well as a comparison with similar homes in the area
Home Values in the Area
Average Home Value in this Area
Purchase History
| Date | Buyer | Sale Price | Title Company |
|---|---|---|---|
| Peterson Jacob | -- | Platinum Title Services | |
| Burgess Tad | -- | Gateway Title Ins Agcy Llc | |
| Burgess Tad | -- | Backman Title Services | |
| Beneficial Utah Inc | $153,181 | Inwest Title Services | |
| Snedeger Michael K | -- | Accommodation | |
| Snedeger Michael K | -- | Bonneville Superior Title | |
| Snedeger Michael K | -- | Bonneville Superior Title | |
| Snedeger Michael J | -- | Bonneville Superior Title | |
| Mallari Christian B | -- | Title One | |
| Mallari Christian B | -- | -- |
Source: Public Records
Mortgage History
| Date | Status | Borrower | Loan Amount |
|---|---|---|---|
| Open | Peterson Jacob | $274,928 | |
| Previous Owner | Burgess Tad | $152,625 | |
| Previous Owner | Burgess Tad | $154,913 | |
| Previous Owner | Snedeger Michael K | $182,300 | |
| Previous Owner | Snedeger Michael J | $26,500 | |
| Previous Owner | Snedeger Michael J | $106,000 | |
| Previous Owner | Mallari Christian B | $104,000 |
Source: Public Records
Tax History Compared to Growth
Tax History
| Year | Tax Paid | Tax Assessment Tax Assessment Total Assessment is a certain percentage of the fair market value that is determined by local assessors to be the total taxable value of land and additions on the property. | Land | Improvement |
|---|---|---|---|---|
| 2025 | $2,443 | $474,500 | $107,200 | $367,300 |
| 2024 | $2,443 | $470,100 | $104,100 | $366,000 |
| 2023 | $2,314 | $419,600 | $97,300 | $322,300 |
| 2022 | $2,386 | $425,700 | $95,400 | $330,300 |
| 2021 | $1,990 | $323,200 | $70,600 | $252,600 |
| 2020 | $1,995 | $304,000 | $70,600 | $233,400 |
| 2019 | $1,958 | $292,600 | $70,600 | $222,000 |
| 2018 | $1,743 | $258,300 | $66,600 | $191,700 |
| 2017 | $1,525 | $225,000 | $66,600 | $158,400 |
| 2016 | $1,396 | $193,600 | $66,600 | $127,000 |
| 2015 | $1,427 | $192,900 | $66,000 | $126,900 |
| 2014 | $1,366 | $181,800 | $62,800 | $119,000 |
Source: Public Records
Map
Nearby Homes
- 3888 W 8700 S
- 8461 S Meadowlark Ln
- 3931 W Dansere Cir
- 8983 S 3860 W
- 8400 S 4000 W Unit 134
- 3214 W Monterey Pine Ln
- 3750 W Bingham Creek Dr
- 8493 S 3200 W
- 8180 S Old Bingham Hwy
- 3977 W Elwood Way
- 2990 W 8870 S
- 3112 Green Acre Dr
- 8941 S Sun Leaf Dr
- 2970 W 8870 S
- 7991 S 3725 W
- 3702 W Angus Dr
- 7989 S 3725 W
- 8058 S Lismore Ln Unit 304
- 8407 Meadow Green Way
- 3332 Lower Newark Way
- 8719 S Newell Dr
- 8711 Newell Dr
- 8711 S Newell Dr
- 8710 S 3680 W
- 8718 S 3680 W
- 8700 S 3680 W
- 8730 Newell Dr
- 8718 Newell Dr
- 8705 Newell Dr
- 8688 S 3680 W
- 3708 Newell Dr
- 3708 W Newell Dr
- 3716 Newell Dr
- 3715 Newell Dr
- 8705 S 3680 W
- 8698 S 3680 W
- 3671 W Old Bingham Hwy
- 8739 S 3720 W
- 3695 W 8660 S
- 8693 S 3680 W