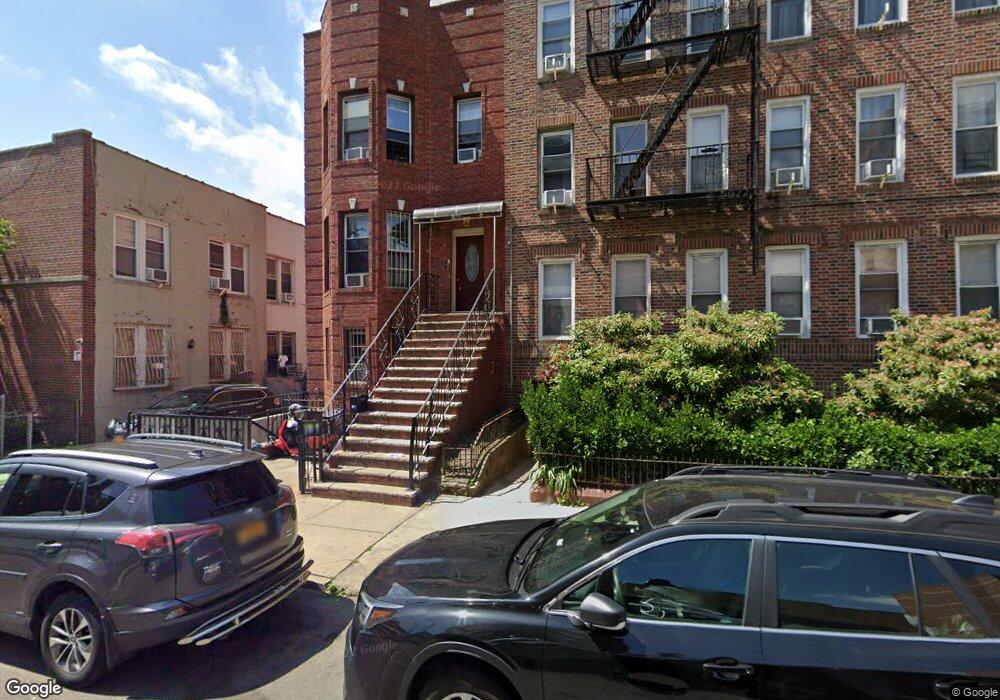
872 50th St Brooklyn, NY 11220
Sunset Park NeighborhoodEstimated Value: $1,801,000 - $2,541,000
Studio
--
Bath
3,604
Sq Ft
$587/Sq Ft
Est. Value
About This Home
This home is located at 872 50th St, Brooklyn, NY 11220 and is currently estimated at $2,114,529, approximately $586 per square foot. 872 50th St is a home located in Kings County with nearby schools including P.S. 160 William T Sampson School, IS 220 John J. Pershing, and Franklin Delano Roosevelt High School.
Ownership History
Date
Name
Owned For
Owner Type
Purchase Details
Closed on
Feb 13, 2008
Sold by
Klein Joseph
Bought by
Cai Yi Ming
Current Estimated Value
Home Financials for this Owner
Home Financials are based on the most recent Mortgage that was taken out on this home.
Original Mortgage
$230,000
Outstanding Balance
$142,435
Interest Rate
5.8%
Estimated Equity
$1,972,095
Purchase Details
Closed on
Feb 27, 2004
Sold by
171-G Realty Inc
Bought by
Klein Joseph
Home Financials for this Owner
Home Financials are based on the most recent Mortgage that was taken out on this home.
Original Mortgage
$427,000
Interest Rate
5.6%
Mortgage Type
Purchase Money Mortgage
Purchase Details
Closed on
Feb 18, 2004
Sold by
Miller Daniel
Bought by
171 G Realty Inc
Home Financials for this Owner
Home Financials are based on the most recent Mortgage that was taken out on this home.
Original Mortgage
$427,000
Interest Rate
5.6%
Mortgage Type
Purchase Money Mortgage
Create a Home Valuation Report for This Property
The Home Valuation Report is an in-depth analysis detailing your home's value as well as a comparison with similar homes in the area
Home Values in the Area
Average Home Value in this Area
Purchase History
| Date | Buyer | Sale Price | Title Company |
|---|---|---|---|
| Cai Yi Ming | $1,250,000 | -- | |
| Cai Yi Ming | $1,250,000 | -- | |
| Klein Joseph | $725,000 | -- | |
| Klein Joseph | $725,000 | -- | |
| 171 G Realty Inc | $385,000 | -- | |
| 171 G Realty Inc | $385,000 | -- |
Source: Public Records
Mortgage History
| Date | Status | Borrower | Loan Amount |
|---|---|---|---|
| Open | Cai Yi Ming | $230,000 | |
| Closed | Cai Yi Ming | $230,000 | |
| Open | Cai Yi Ming | $645,000 | |
| Closed | Cai Yi Ming | $645,000 | |
| Previous Owner | Klein Joseph | $427,000 |
Source: Public Records
Tax History
| Year | Tax Paid | Tax Assessment Tax Assessment Total Assessment is a certain percentage of the fair market value that is determined by local assessors to be the total taxable value of land and additions on the property. | Land | Improvement |
|---|---|---|---|---|
| 2025 | $8,929 | $125,040 | $25,680 | $99,360 |
| 2024 | $8,929 | $112,740 | $25,680 | $87,060 |
| 2023 | $8,518 | $100,860 | $25,680 | $75,180 |
| 2022 | $8,115 | $93,960 | $25,680 | $68,280 |
| 2021 | $8,306 | $93,240 | $25,680 | $67,560 |
| 2020 | $8,240 | $103,860 | $25,680 | $78,180 |
| 2019 | $7,750 | $112,620 | $25,680 | $86,940 |
| 2018 | $7,125 | $34,952 | $9,367 | $25,585 |
| 2017 | $6,906 | $33,877 | $9,235 | $24,642 |
| 2016 | $6,628 | $33,157 | $9,576 | $23,581 |
| 2015 | $3,855 | $32,440 | $13,323 | $19,117 |
| 2014 | $3,855 | $30,874 | $10,782 | $20,092 |
Source: Public Records
Map
Nearby Homes
Your Personal Tour Guide
Ask me questions while you tour the home.