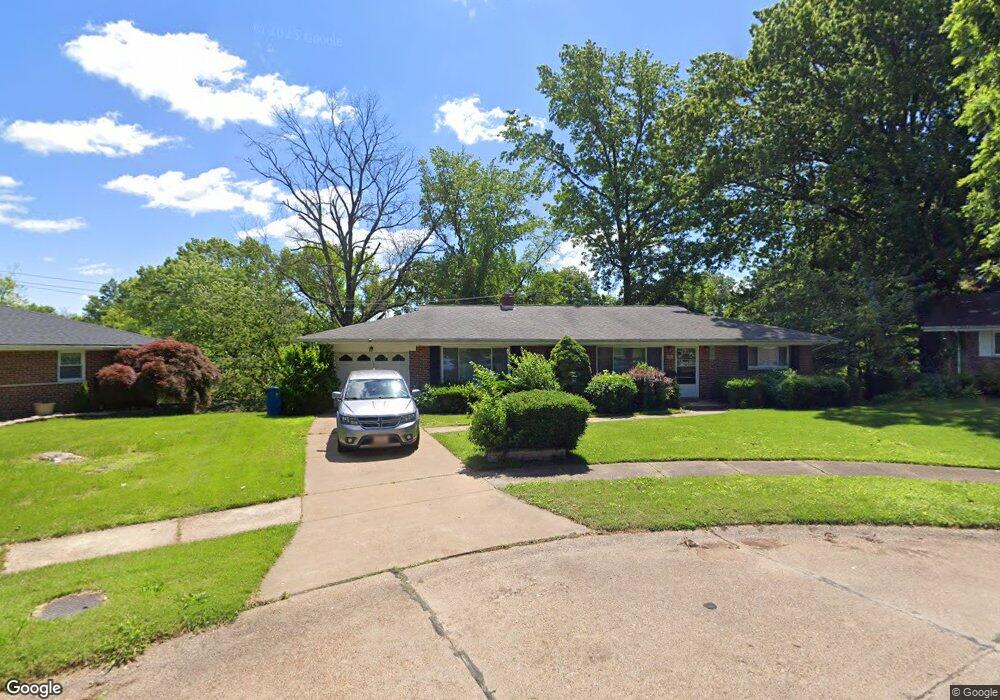
872 Cernicek Ln Saint Louis, MO 63135
Estimated Value: $152,607 - $178,000
3
Beds
2
Baths
1,580
Sq Ft
$104/Sq Ft
Est. Value
About This Home
This home is located at 872 Cernicek Ln, Saint Louis, MO 63135 and is currently estimated at $163,652, approximately $103 per square foot. 872 Cernicek Ln is a home located in St. Louis County with nearby schools including Vogt Elementary School, Ferguson Middle School, and McCluer High School.
Ownership History
Date
Name
Owned For
Owner Type
Purchase Details
Closed on
Oct 3, 2013
Sold by
Secretary Of Housing & Urban Development
Bought by
Bltreiv3 St Louis Llc
Current Estimated Value
Purchase Details
Closed on
Aug 15, 2012
Sold by
U S Bank National Association
Bought by
Secretary Of Housing & Urban Development
Purchase Details
Closed on
May 15, 2012
Sold by
Moore Jordan Stacey A and Jordan Rahson R
Bought by
U S Bank National Association
Purchase Details
Closed on
Jan 17, 2006
Sold by
Day Doris A
Bought by
Jordan Rahson R and Moore Jordan Stacey A
Home Financials for this Owner
Home Financials are based on the most recent Mortgage that was taken out on this home.
Original Mortgage
$113,760
Interest Rate
7.42%
Mortgage Type
Stand Alone First
Create a Home Valuation Report for This Property
The Home Valuation Report is an in-depth analysis detailing your home's value as well as a comparison with similar homes in the area
Home Values in the Area
Average Home Value in this Area
Purchase History
| Date | Buyer | Sale Price | Title Company |
|---|---|---|---|
| Bltreiv3 St Louis Llc | $65,000 | Resolutions Title Inc | |
| Secretary Of Housing & Urban Development | $143,090 | Continental Title Company | |
| U S Bank National Association | $163,371 | None Available | |
| Jordan Rahson R | $142,200 | None Available |
Source: Public Records
Mortgage History
| Date | Status | Borrower | Loan Amount |
|---|---|---|---|
| Previous Owner | Jordan Rahson R | $113,760 |
Source: Public Records
Tax History Compared to Growth
Tax History
| Year | Tax Paid | Tax Assessment Tax Assessment Total Assessment is a certain percentage of the fair market value that is determined by local assessors to be the total taxable value of land and additions on the property. | Land | Improvement |
|---|---|---|---|---|
| 2025 | $1,973 | $30,750 | $3,710 | $27,040 |
| 2024 | $1,973 | $27,290 | $2,570 | $24,720 |
| 2023 | $1,962 | $27,290 | $2,570 | $24,720 |
| 2022 | $1,966 | $23,840 | $3,210 | $20,630 |
| 2021 | $1,903 | $23,840 | $3,210 | $20,630 |
| 2020 | $1,962 | $22,110 | $2,810 | $19,300 |
| 2019 | $1,925 | $22,110 | $2,810 | $19,300 |
| 2018 | $1,307 | $13,300 | $2,470 | $10,830 |
| 2017 | $1,281 | $13,300 | $2,470 | $10,830 |
| 2016 | $1,302 | $13,300 | $2,090 | $11,210 |
| 2015 | $1,310 | $13,300 | $2,090 | $11,210 |
| 2014 | $1,417 | $14,250 | $3,360 | $10,890 |
Source: Public Records
Map
Nearby Homes
- 50 Fenwick Dr
- 1006 Highmont Dr
- 57 Forestwood Dr
- 125 Forestwood Dr
- 1108 Renshaw Dr
- 135 S Barat Ave
- 33 S Schlueter Ave
- 208 Coppinger Dr
- 141 S Barat Ave
- 1209 Chambers Rd
- 1330 Chambers Rd
- 49 S Dellwood Ave
- 315 Coppinger Dr
- 310 Ames Place
- 408 Coppinger Dr
- 299 Dashwood Dr
- 506 Averill Ave
- 29 Godfrey Ln
- 324 Ames Place
- 109 Florwood Ct
- 866 Cernicek Ln
- 31 Bayview Dr
- 35 Bayview Dr
- 871 Cernicek Ln
- 27 Bayview Dr
- 39 Bayview Dr
- 862 Cernicek Ln
- 109 Bayview Dr
- 867 Cernicek Ln
- 23 Bayview Dr
- 113 Bayview Dr
- 101 Bayview Dr
- 861 Cernicek Ln
- 19 Bayview Dr
- 117 Bayview Dr
- 856 Cernicek Ln
- 15 Bayview Dr
- 20 Bayview Dr
- 914 Cheri Heights Ct
- 29 Fenwick Dr