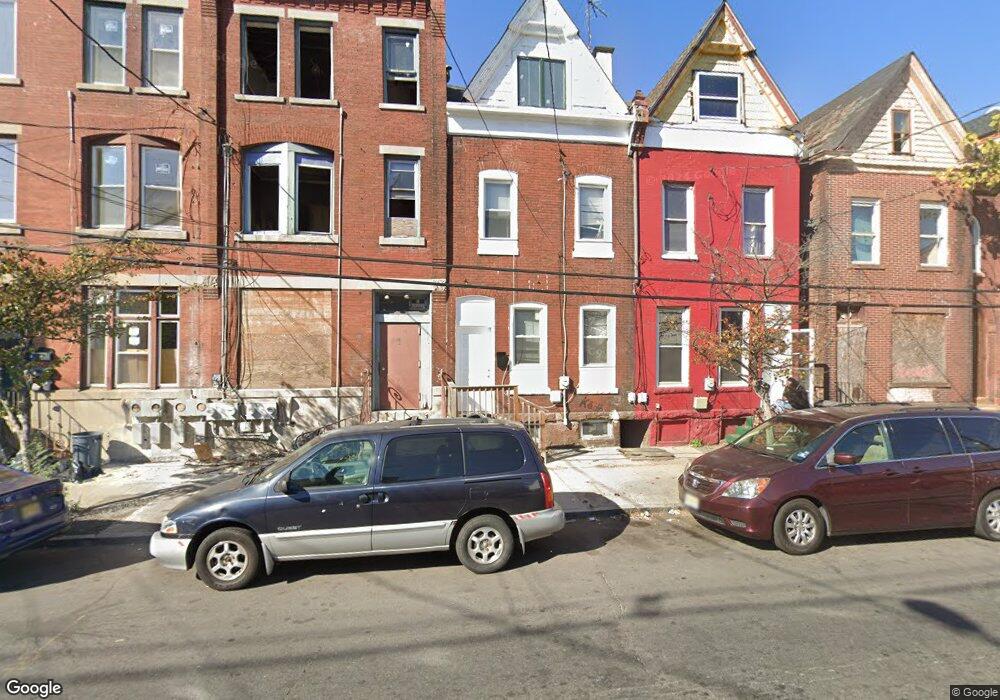
872 E State St Trenton, NJ 08609
Wilbur NeighborhoodEstimated Value: $140,506 - $273,000
Studio
1
Bath
2,130
Sq Ft
$100/Sq Ft
Est. Value
About This Home
This home is located at 872 E State St, Trenton, NJ 08609 and is currently estimated at $213,127, approximately $100 per square foot. 872 E State St is a home located in Mercer County with nearby schools including P.J. Hill Elementary School, Grant Elementary School, and Dr. Martin Luther King Middle School.
Ownership History
Date
Name
Owned For
Owner Type
Purchase Details
Closed on
Jan 21, 2021
Sold by
Finfree Properties Llc
Bought by
Finfree Trenton Llc
Current Estimated Value
Home Financials for this Owner
Home Financials are based on the most recent Mortgage that was taken out on this home.
Original Mortgage
$560,651
Outstanding Balance
$499,410
Interest Rate
2.6%
Mortgage Type
Commercial
Estimated Equity
-$286,283
Create a Home Valuation Report for This Property
The Home Valuation Report is an in-depth analysis detailing your home's value as well as a comparison with similar homes in the area
Home Values in the Area
Average Home Value in this Area
Purchase History
| Date | Buyer | Sale Price | Title Company |
|---|---|---|---|
| Finfree Trenton Llc | $416,226 | Acres Land Title Agency Inc |
Source: Public Records
Mortgage History
| Date | Status | Borrower | Loan Amount |
|---|---|---|---|
| Open | Finfree Trenton Llc | $560,651 |
Source: Public Records
Tax History
| Year | Tax Paid | Tax Assessment Tax Assessment Total Assessment is a certain percentage of the fair market value that is determined by local assessors to be the total taxable value of land and additions on the property. | Land | Improvement |
|---|---|---|---|---|
| 2025 | $1,450 | $33,700 | $5,600 | $28,100 |
| 2024 | $1,392 | $25,000 | $5,600 | $19,400 |
| 2023 | $1,392 | $25,000 | $5,600 | $19,400 |
| 2022 | $1,365 | $25,000 | $5,600 | $19,400 |
| 2021 | $1,388 | $25,000 | $5,600 | $19,400 |
| 2020 | $1,384 | $25,000 | $5,600 | $19,400 |
| 2019 | $1,835 | $33,700 | $5,600 | $28,100 |
| 2018 | $1,757 | $33,700 | $5,600 | $28,100 |
| 2017 | $1,670 | $33,700 | $5,600 | $28,100 |
| 2016 | $1,559 | $27,100 | $6,000 | $21,100 |
| 2015 | $1,554 | $27,100 | $6,000 | $21,100 |
| 2014 | $1,546 | $27,100 | $6,000 | $21,100 |
Source: Public Records
Map
Nearby Homes
Your Personal Tour Guide
Ask me questions while you tour the home.