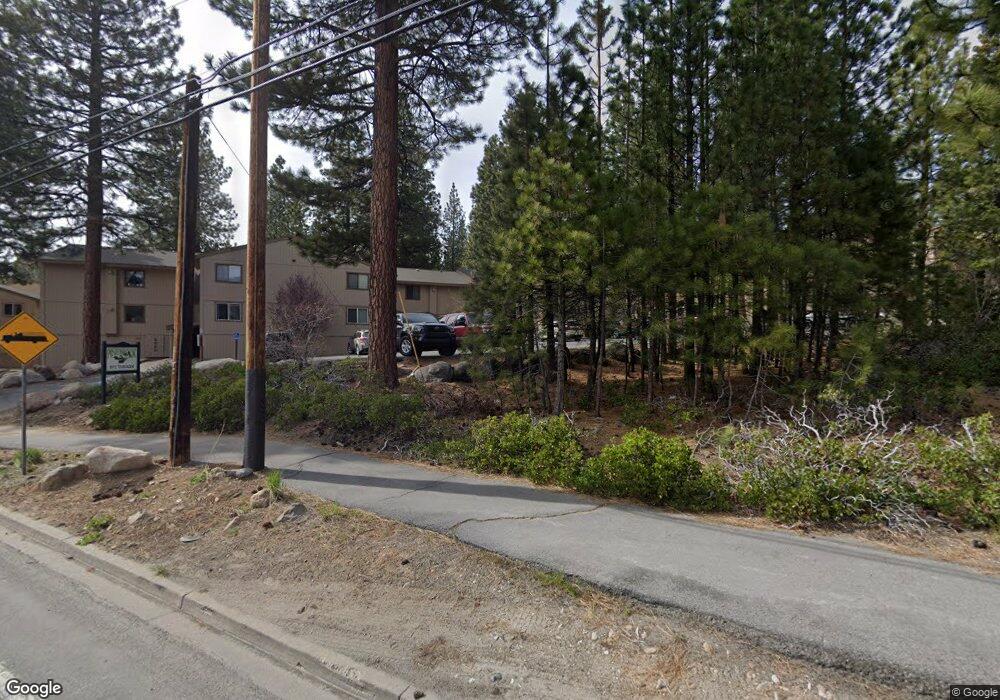
872 Tanager St, Unit 42 Incline Village, NV 89451
Estimated Value: $248,000 - $398,000
1
Bed
1
Bath
600
Sq Ft
$593/Sq Ft
Est. Value
About This Home
This home is located at 872 Tanager St Unit 42, Incline Village, NV 89451 and is currently estimated at $356,008, approximately $593 per square foot. 872 Tanager St Unit 42 is a home located in Washoe County with nearby schools including Incline Elementary School, Incline Middle School, and Incline High School.
Ownership History
Date
Name
Owned For
Owner Type
Purchase Details
Closed on
Apr 19, 2021
Sold by
Lange Hans J and Chashchina Svetlana
Bought by
Chashchina Svetlana
Current Estimated Value
Purchase Details
Closed on
Dec 12, 2009
Sold by
Greasley Tony
Bought by
Svetlana Lange Hans J and Svetlana Chashchina
Purchase Details
Closed on
Dec 30, 2005
Sold by
Pinebrook Llc
Bought by
Greasley Tony
Home Financials for this Owner
Home Financials are based on the most recent Mortgage that was taken out on this home.
Original Mortgage
$230,000
Interest Rate
7%
Mortgage Type
New Conventional
Purchase Details
Closed on
Jul 6, 2004
Sold by
Bricken Lp
Bought by
Pinebrook Llc
Home Financials for this Owner
Home Financials are based on the most recent Mortgage that was taken out on this home.
Original Mortgage
$2,000,000
Interest Rate
5.95%
Mortgage Type
Unknown
Purchase Details
Closed on
Feb 23, 2000
Sold by
Mt Brook Station Cooperative Apartment H
Bought by
Bricken Ltd Partnership
Create a Home Valuation Report for This Property
The Home Valuation Report is an in-depth analysis detailing your home's value as well as a comparison with similar homes in the area
Home Values in the Area
Average Home Value in this Area
Purchase History
| Date | Buyer | Sale Price | Title Company |
|---|---|---|---|
| Chashchina Svetlana | -- | None Available | |
| Svetlana Lange Hans J | $90,000 | First Centennial Reno | |
| Greasley Tony | $287,500 | First American Title | |
| Pinebrook Llc | $2,712,500 | Stewart Title Of Northern Nv | |
| Bricken Ltd Partnership | $75,000 | First Centennial Title Co |
Source: Public Records
Mortgage History
| Date | Status | Borrower | Loan Amount |
|---|---|---|---|
| Previous Owner | Greasley Tony | $230,000 | |
| Previous Owner | Pinebrook Llc | $2,000,000 |
Source: Public Records
Tax History Compared to Growth
Tax History
| Year | Tax Paid | Tax Assessment Tax Assessment Total Assessment is a certain percentage of the fair market value that is determined by local assessors to be the total taxable value of land and additions on the property. | Land | Improvement |
|---|---|---|---|---|
| 2025 | $1,150 | $40,649 | $30,135 | $10,514 |
| 2024 | $1,150 | $37,813 | $26,670 | $11,143 |
| 2023 | $1,135 | $41,456 | $31,430 | $10,026 |
| 2022 | $1,441 | $33,290 | $23,940 | $9,350 |
| 2021 | $1,392 | $24,725 | $15,295 | $9,430 |
| 2020 | $1,404 | $22,632 | $13,090 | $9,542 |
| 2019 | $1,376 | $20,512 | $11,200 | $9,312 |
| 2018 | $1,351 | $17,319 | $8,120 | $9,199 |
| 2017 | $1,331 | $17,192 | $8,015 | $9,177 |
| 2016 | $1,318 | $17,023 | $7,490 | $9,533 |
| 2015 | $987 | $14,411 | $5,215 | $9,196 |
| 2014 | $1,302 | $14,045 | $4,690 | $9,355 |
| 2013 | -- | $13,309 | $3,885 | $9,424 |
Source: Public Records
About This Building
Map
Nearby Homes
- 872 Tanager St Unit 32
- 872 Tanager St Unit 55
- 872 Tanager St Unit 61
- 830 Oriole Way Unit 7
- 866 Southwood Blvd
- 845 Southwood Blvd Unit 60
- 845 Southwood Blvd Unit 7
- 209 Robin Dr Unit 6
- 827 Robin Dr Unit 8
- 827 Robin Dr
- 915 Incline Way Unit 203
- 837 Southwood Blvd Unit 20
- 837 Southwood Blvd Unit 1
- 825 Southwood Blvd Unit 12
- 825 Southwood Blvd Unit 11
- 825 Southwood Blvd Unit 18
- 807 Alder Ave Unit 89
- 807 Alder Ave Unit 44
- 807 Alder Ave Unit 82
- 807 Alder Ave Unit 14
- 872 Tanager St
- 872 Tanager St Unit 872 Tanager
- 872 Tanager St
- 872 Tanager St Unit 64
- 872 Tanager St Unit 63
- 872 Tanager St Unit 62
- 872 Tanager St Unit 59
- 872 Tanager St Unit 210
- 872 Tanager St Unit 49
- 872 Tanager St Unit 47
- 872 Tanager St Unit 47
- 872 Tanager St Unit 46
- 872 Tanager St Unit 45
- 872 Tanager St Unit 45
- 872 Tanager St Unit 43
- 872 Tanager St Unit 33
- 872 Tanager St Unit 32
- 872 Tanager St Unit 31
- 872 Tanager St Unit 30
- 872 Tanager St Unit 29