Estimated Value: $278,000 - $335,000
3
Beds
2
Baths
1,426
Sq Ft
$209/Sq Ft
Est. Value
About This Home
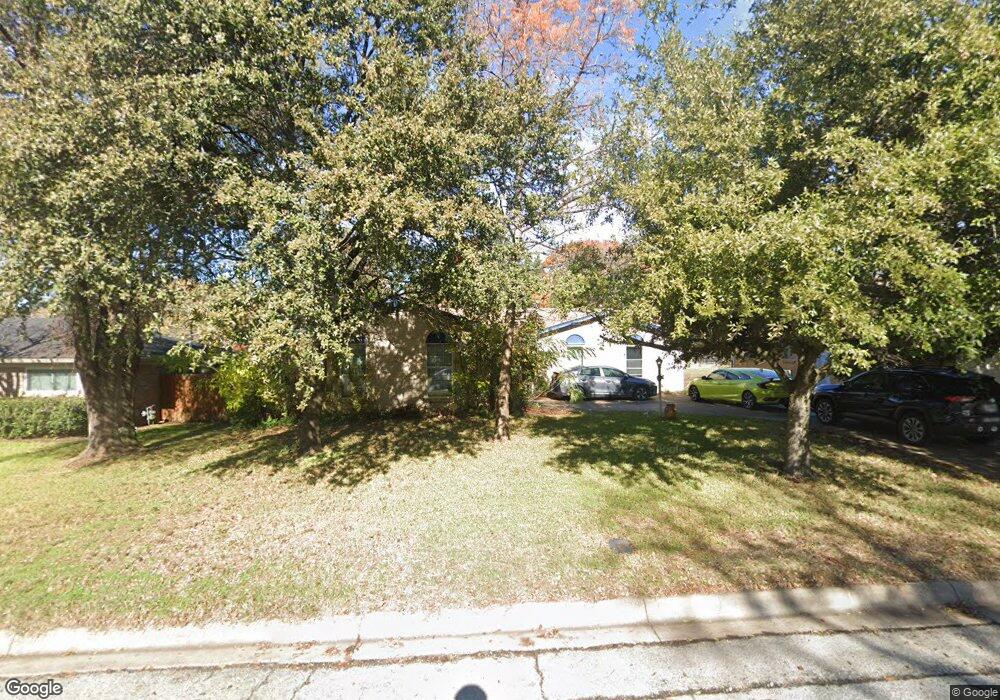
This home is located at 872 W Redbud Dr, Hurst, TX 76053 and is currently estimated at $297,909, approximately $208 per square foot. 872 W Redbud Dr is a home located in Tarrant County with nearby schools including West Hurst Elementary School, Hurst J High School, and L.D. Bell High School.
Ownership History
Date
Name
Owned For
Owner Type
Purchase Details
Closed on
Jul 28, 1997
Sold by
Hodges Janet S and Young Elizabeth A
Bought by
Duffy Robert P
Current Estimated Value
Home Financials for this Owner
Home Financials are based on the most recent Mortgage that was taken out on this home.
Original Mortgage
$82,416
Outstanding Balance
$12,418
Interest Rate
7.6%
Mortgage Type
VA
Estimated Equity
$285,491
Create a Home Valuation Report for This Property
The Home Valuation Report is an in-depth analysis detailing your home's value as well as a comparison with similar homes in the area
Home Values in the Area
Average Home Value in this Area
Purchase History
| Date | Buyer | Sale Price | Title Company |
|---|---|---|---|
| Duffy Robert P | -- | Safeco Land Title |
Source: Public Records
Mortgage History
| Date | Status | Borrower | Loan Amount |
|---|---|---|---|
| Open | Duffy Robert P | $82,416 |
Source: Public Records
Tax History Compared to Growth
Tax History
| Year | Tax Paid | Tax Assessment Tax Assessment Total Assessment is a certain percentage of the fair market value that is determined by local assessors to be the total taxable value of land and additions on the property. | Land | Improvement |
|---|---|---|---|---|
| 2025 | $2,750 | $220,640 | $50,400 | $170,240 |
| 2024 | $2,750 | $220,640 | $50,400 | $170,240 |
| 2023 | $3,714 | $185,380 | $42,000 | $143,380 |
| 2022 | $3,963 | $172,136 | $42,000 | $130,136 |
| 2021 | $3,980 | $165,028 | $50,000 | $115,028 |
| 2020 | $3,898 | $172,856 | $50,000 | $122,856 |
| 2019 | $3,605 | $174,005 | $50,000 | $124,005 |
| 2018 | $2,740 | $133,899 | $25,000 | $108,899 |
| 2017 | $3,080 | $142,977 | $25,000 | $117,977 |
| 2016 | $2,800 | $128,572 | $25,000 | $103,572 |
| 2015 | $2,241 | $100,600 | $20,000 | $80,600 |
| 2014 | $2,241 | $100,600 | $20,000 | $80,600 |
Source: Public Records
Map
Nearby Homes
- 425 Moore Creek Rd
- 512 Billie Ruth Ln
- 405 Billy Creek Cir
- 808 Betty Ct
- 741 Ponderosa Dr
- 649 Timberline Dr
- 758 Briarwood Ln
- 756 Briarwood Ln
- 632 Melbourne Ct
- 744 Briarwood Ln
- 425 Ridgecrest Dr
- 1200 Walker Dr
- 1112 Blakey Ct
- 637 Post Oak Dr
- 628 Elm St
- 829 Joanna Dr
- 913 Zelda Dr
- 916 Zelda Dr
- 612 Elm St
- 1304 W Redbud Dr
- 868 W Redbud Dr
- 876 W Redbud Dr
- 504 Englewood Ln
- 864 W Redbud Dr
- 857 W Redbud Dr
- 853 Oakwood Ave
- 433 Apple Blossom Ln
- 432 Englewood Ln
- 860 W Redbud Dr
- 901 Oakwood Ave
- 849 Oakwood Ave
- 501 Englewood Ln
- 849 W Redbud Dr
- 428 Englewood Ln
- 856 W Redbud Dr
- 433 Englewood Ln
- 845 Oakwood Ave
- 845 W Redbud Dr
- 424 Apple Blossom Ln
- 425 Apple Blossom Ln