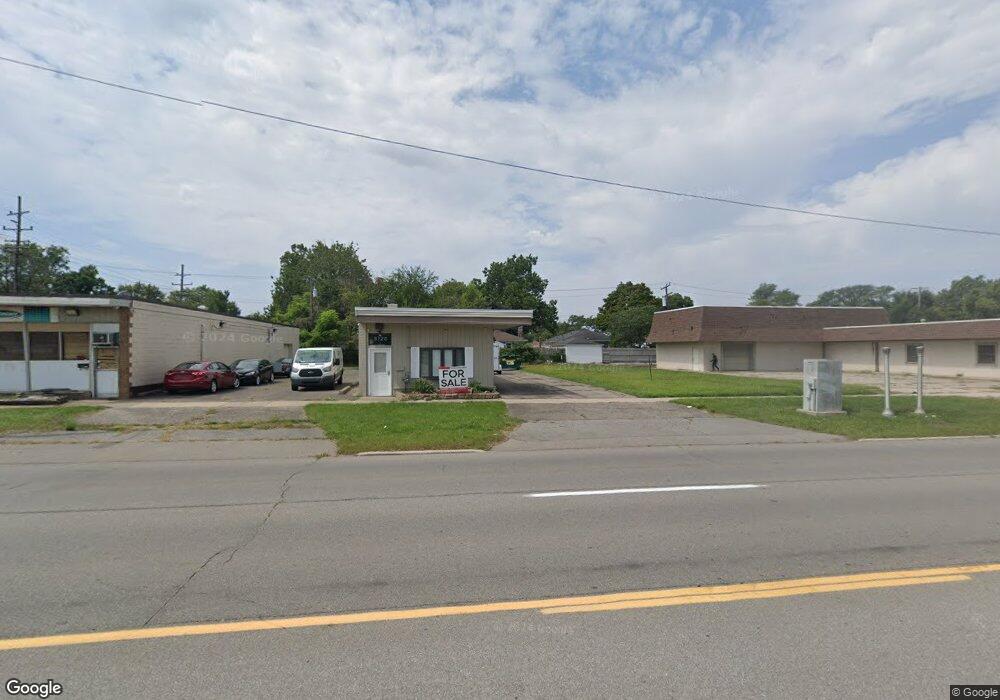
8720 Pelham Rd Taylor, MI 48180
Estimated Value: $125,275
--
Bed
--
Bath
1,200
Sq Ft
$104/Sq Ft
Est. Value
About This Home
This home is located at 8720 Pelham Rd, Taylor, MI 48180 and is currently estimated at $125,275, approximately $104 per square foot. 8720 Pelham Rd is a home located in Wayne County with nearby schools including Blair Moody Elementary School, Robert J. West Middle School, and Cabrini Elementary & Middle School.
Ownership History
Date
Name
Owned For
Owner Type
Purchase Details
Closed on
Jun 15, 2025
Sold by
Obad Khaled Mohamed Monea
Bought by
Thankfull Llc
Current Estimated Value
Purchase Details
Closed on
Aug 8, 2023
Sold by
Barber Place Llc
Bought by
Hojeij Services Llc
Purchase Details
Closed on
May 28, 2020
Sold by
Taylor South Investment Llc
Bought by
Barber Place Llc
Purchase Details
Closed on
Feb 8, 2019
Sold by
Taylor Rehab Twelve Llc
Bought by
Taylor South Investment Llc
Purchase Details
Closed on
Aug 21, 2018
Sold by
City Of Taylor
Bought by
Taylor Rehab Twelve Llc
Purchase Details
Closed on
Aug 10, 2018
Sold by
Sabree Eric R
Bought by
Treasure City Of Taylor
Purchase Details
Closed on
May 3, 2007
Sold by
Hogan Michael P and Hogan Kathryn M
Bought by
Hogan Michael P
Purchase Details
Closed on
Feb 4, 2000
Sold by
Kerns Joseph B and Kerns Patsy R
Bought by
Hogan Kathryn M
Create a Home Valuation Report for This Property
The Home Valuation Report is an in-depth analysis detailing your home's value as well as a comparison with similar homes in the area
Home Values in the Area
Average Home Value in this Area
Purchase History
| Date | Buyer | Sale Price | Title Company |
|---|---|---|---|
| Thankfull Llc | -- | None Listed On Document | |
| Thankfull Llc | -- | None Listed On Document | |
| Hojeij Services Llc | $125,000 | Michigan Title Insurance Agenc | |
| Barber Place Llc | $45,000 | Michigan Title Ins Agcy Inc | |
| Taylor South Investment Llc | -- | None Available | |
| Taylor Rehab Twelve Llc | -- | None Available | |
| Treasure City Of Taylor | $3,531 | None Available | |
| Hogan Michael P | -- | Minnesota Title Agency | |
| Hogan Kathryn M | $60,000 | -- |
Source: Public Records
Tax History Compared to Growth
Tax History
| Year | Tax Paid | Tax Assessment Tax Assessment Total Assessment is a certain percentage of the fair market value that is determined by local assessors to be the total taxable value of land and additions on the property. | Land | Improvement |
|---|---|---|---|---|
| 2025 | $2,778 | $49,500 | $0 | $0 |
| 2024 | $2,778 | $45,300 | $0 | $0 |
| 2023 | $2,514 | $39,700 | $0 | $0 |
| 2022 | $2,246 | $36,600 | $0 | $0 |
| 2021 | $2,402 | $34,200 | $0 | $0 |
| 2020 | $2,801 | $33,400 | $0 | $0 |
| 2019 | $250,224 | $34,300 | $0 | $0 |
| 2018 | $1,645 | $33,800 | $0 | $0 |
| 2017 | $2,601 | $37,200 | $0 | $0 |
| 2016 | $3,403 | $37,200 | $0 | $0 |
| 2015 | $2,595 | $37,200 | $0 | $0 |
| 2013 | $2,514 | $37,200 | $0 | $0 |
| 2012 | $1,347 | $37,200 | $7,000 | $30,200 |
Source: Public Records
Map
Nearby Homes
- 20100 Wick Rd
- 20234 Champaign St
- 9134 Weddel St
- 8025 Mayfair St
- 8951 Rackham St
- 7854 Jackson St
- 7868 Robinson Ave
- 17439 Brody Ave
- 8027 Kolb Ave
- 7713 Jackson St
- 20812 Wick Rd
- 20742 Champaign St
- 20968 Shannon St
- 7580 Mayfair St
- 9036 Reeck Rd
- 9444 Polk St
- 8910 Mason St
- 7210 Buckingham Ave
- 8511 Allen Rd
- 8911 Manor Ave
- 8719 Ziegler St
- 8729 Ziegler St
- 8709 Ziegler St
- 8739 Ziegler St
- 8749 Ziegler St
- 8757 Ziegler St
- 8391 Ziegler St
- 8400 Pelham Rd
- 8379 Ziegler St
- 8371 Ziegler St
- 8736 Ziegler St
- 8728 Ziegler St
- 8748 Ziegler St
- 8718 Ziegler St
- 8754 Ziegler St
- 8708 Ziegler St
- 8359 Ziegler St
- 8392 Ziegler St
- 8380 Ziegler St
- 8351 Ziegler St