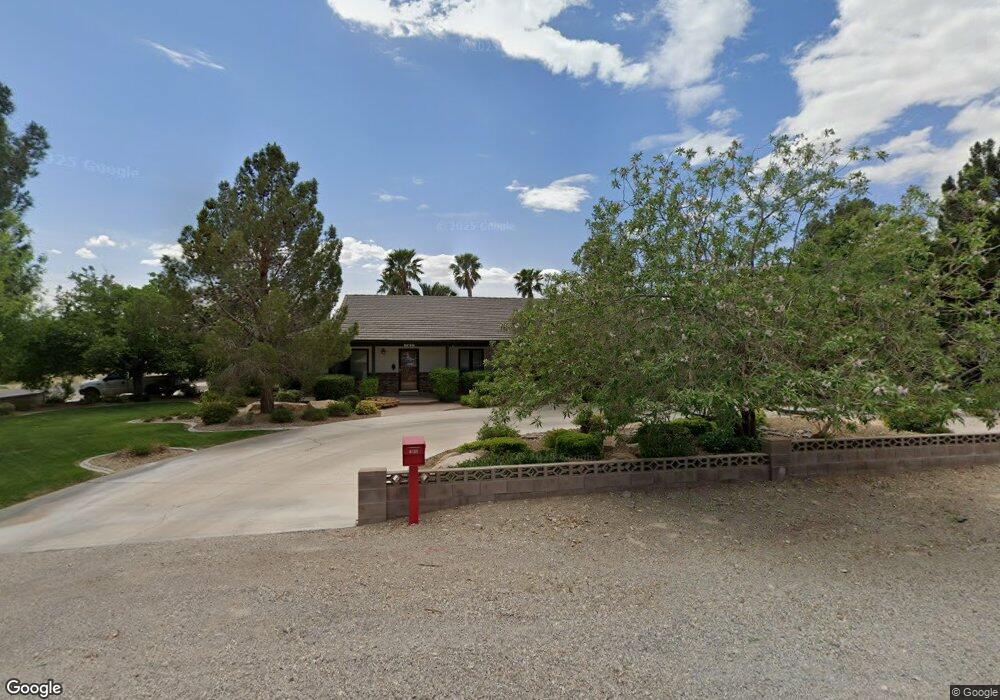
8720 W La Madre Way Las Vegas, NV 89149
Estimated Value: $869,880 - $980,000
4
Beds
3
Baths
3,108
Sq Ft
$293/Sq Ft
Est. Value
About This Home
This home is located at 8720 W La Madre Way, Las Vegas, NV 89149 and is currently estimated at $911,720, approximately $293 per square foot. 8720 W La Madre Way is a home located in Clark County with nearby schools including Dean Lamar Allen Elementary School, Justice Myron E Leavitt Middle School, and Centennial High School.
Ownership History
Date
Name
Owned For
Owner Type
Purchase Details
Closed on
Mar 31, 2000
Sold by
Dillingham Michael G and Dillingham Renee
Bought by
Dillingham Michael G and Dillingham Renee
Current Estimated Value
Home Financials for this Owner
Home Financials are based on the most recent Mortgage that was taken out on this home.
Original Mortgage
$62,000
Interest Rate
8.3%
Purchase Details
Closed on
Apr 6, 1999
Sold by
Dillingham Michael G and Dillingham Tomaseta M
Bought by
Dillingham Michael G
Home Financials for this Owner
Home Financials are based on the most recent Mortgage that was taken out on this home.
Original Mortgage
$204,000
Interest Rate
6.98%
Create a Home Valuation Report for This Property
The Home Valuation Report is an in-depth analysis detailing your home's value as well as a comparison with similar homes in the area
Home Values in the Area
Average Home Value in this Area
Purchase History
| Date | Buyer | Sale Price | Title Company |
|---|---|---|---|
| Dillingham Michael G | -- | Nevada Title Company | |
| Dillingham Michael G | -- | Land Title |
Source: Public Records
Mortgage History
| Date | Status | Borrower | Loan Amount |
|---|---|---|---|
| Closed | Dillingham Michael G | $62,000 | |
| Closed | Dillingham Michael G | $204,000 |
Source: Public Records
Tax History Compared to Growth
Tax History
| Year | Tax Paid | Tax Assessment Tax Assessment Total Assessment is a certain percentage of the fair market value that is determined by local assessors to be the total taxable value of land and additions on the property. | Land | Improvement |
|---|---|---|---|---|
| 2025 | $3,767 | $197,003 | $100,625 | $96,378 |
| 2024 | $3,657 | $197,003 | $100,625 | $96,378 |
| 2023 | $3,657 | $191,039 | $98,438 | $92,601 |
| 2022 | $3,551 | $173,614 | $87,500 | $86,114 |
| 2021 | $3,448 | $152,703 | $70,000 | $82,703 |
| 2020 | $3,344 | $152,770 | $70,000 | $82,770 |
| 2019 | $3,247 | $152,210 | $70,000 | $82,210 |
| 2018 | $3,152 | $137,921 | $57,750 | $80,171 |
| 2017 | $3,237 | $118,738 | $47,250 | $71,488 |
| 2016 | $2,709 | $114,972 | $42,525 | $72,447 |
| 2015 | $2,704 | $97,958 | $26,250 | $71,708 |
| 2014 | $2,625 | $96,947 | $26,250 | $70,697 |
Source: Public Records
Map
Nearby Homes
- 4925 N Juliano Rd
- 8732 Kendall Brook Cir
- 8775 W Verde Way
- 2 W Lone Mountain Rd
- 8525 W Verde Way
- 5215 N Riley St
- 0 W Rosada Way Unit 2735462
- 8975 W Verde Way
- 8970 W Lone Mountain Rd
- 5112 Crown Cypress St
- 4798 Luna Ridge Ct
- 4554 Blue Mesa Way
- 11127 Rolling Vista Dr
- 7740 W Lone Mountain Rd
- 4996 Moncada Way
- 8284 Center Stage Ave
- 5321 N Durango Dr
- 8826 W Stephen Ave
- 9180 W Hammer Ln
- 8842 W Stephen Ave
- 4965 N Juliano Rd
- 8740 W La Madre Way
- 5025 N Juliano Rd
- 4980 N Juliano Rd
- 4945 N Juliano Rd
- 8767 W La Madre Way
- 8745 W La Madre Way
- 4935 N Juliano Rd
- 5035 N Juliano Rd
- 8680 W La Madre Way
- 5045 N Juliano Rd
- 5020 N El Capitan Way
- 4915 N Juliano Rd
- 4940 N El Capitan Way
- 8785 W La Madre Way
- 4970 N El Capitan Way
- 8660 W La Madre Way
- 8660 W Verde Way
- 8690 W Verde Way
- 5040 N El Capitan Way