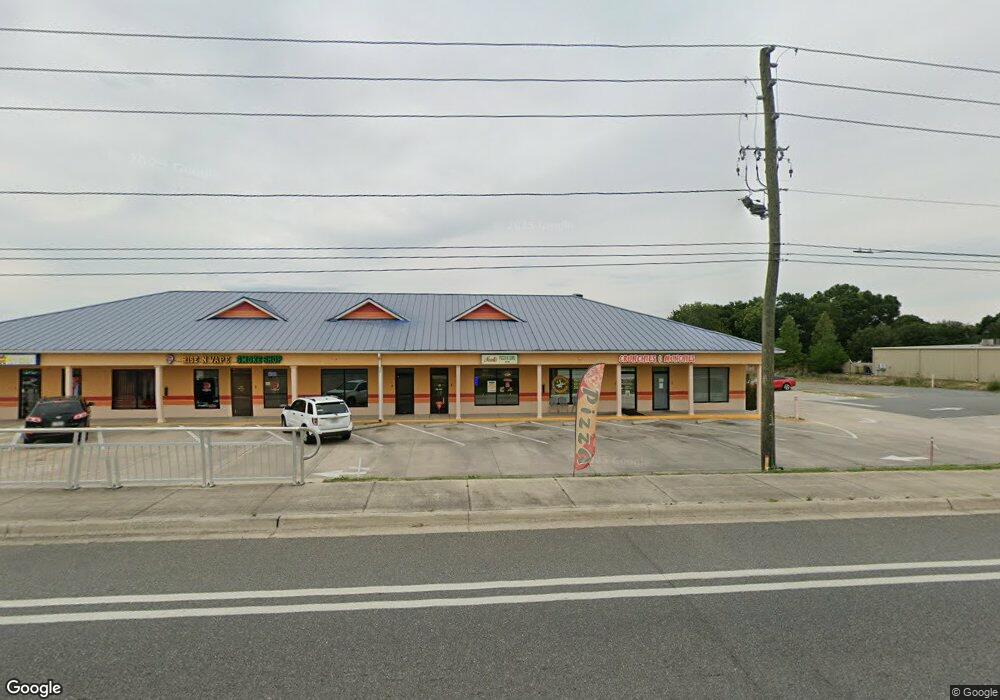
8721 SE 58th Ave Unit 1-2 Ocala, FL 34472
Silver Spring Shores NeighborhoodEstimated Value: $1,095,892
--
Bed
7
Baths
2,000
Sq Ft
$548/Sq Ft
Est. Value
About This Home
This home is located at 8721 SE 58th Ave Unit 1-2, Ocala, FL 34472 and is currently estimated at $1,095,892, approximately $547 per square foot. 8721 SE 58th Ave Unit 1-2 is a home located in Marion County with nearby schools including Legacy Elementary School, Belleview Middle School, and Belleview High School.
Ownership History
Date
Name
Owned For
Owner Type
Purchase Details
Closed on
Jul 31, 2018
Sold by
Roth Leonard
Bought by
Gribble Resort Properties Llc
Current Estimated Value
Home Financials for this Owner
Home Financials are based on the most recent Mortgage that was taken out on this home.
Original Mortgage
$361,630
Outstanding Balance
$314,061
Interest Rate
4.5%
Mortgage Type
Balloon
Estimated Equity
$787,591
Purchase Details
Closed on
Dec 22, 2016
Sold by
Roth Leonard
Bought by
Concept Development Inc
Purchase Details
Closed on
Dec 1, 2016
Bought by
Roth Leonard
Purchase Details
Closed on
Nov 14, 2006
Sold by
Sherman Edward
Bought by
Roth Michael S
Home Financials for this Owner
Home Financials are based on the most recent Mortgage that was taken out on this home.
Original Mortgage
$637,500
Interest Rate
6.3%
Mortgage Type
Construction
Purchase Details
Closed on
Sep 19, 2001
Sold by
Roth Michael S
Bought by
Roth Leonard
Purchase Details
Closed on
Jun 27, 1995
Sold by
Sherman Edward
Bought by
Roth Michael S
Create a Home Valuation Report for This Property
The Home Valuation Report is an in-depth analysis detailing your home's value as well as a comparison with similar homes in the area
Home Values in the Area
Average Home Value in this Area
Purchase History
| Date | Buyer | Sale Price | Title Company |
|---|---|---|---|
| Gribble Resort Properties Llc | $660,000 | 1St Quality Title Llc | |
| Concept Development Inc | $253,000 | Providence Title Co Llc | |
| Roth Leonard | $100 | -- | |
| Roth Michael S | -- | Fidelity Title Services Llc | |
| Roth Leonard | $55,000 | -- | |
| Roth Michael S | $25,000 | -- |
Source: Public Records
Mortgage History
| Date | Status | Borrower | Loan Amount |
|---|---|---|---|
| Open | Gribble Resort Properties Llc | $361,630 | |
| Previous Owner | Roth Michael S | $637,500 |
Source: Public Records
Tax History Compared to Growth
Tax History
| Year | Tax Paid | Tax Assessment Tax Assessment Total Assessment is a certain percentage of the fair market value that is determined by local assessors to be the total taxable value of land and additions on the property. | Land | Improvement |
|---|---|---|---|---|
| 2024 | $12,187 | $702,348 | -- | -- |
| 2023 | $12,187 | $694,270 | $0 | $0 |
| 2022 | $11,235 | $633,302 | $100,623 | $532,679 |
| 2021 | $10,683 | $578,396 | $110,685 | $467,711 |
| 2020 | $10,959 | $590,791 | $110,685 | $480,106 |
| 2019 | $10,694 | $568,529 | $100,623 | $467,906 |
| 2018 | $6,275 | $323,059 | $134,164 | $188,895 |
| 2017 | $5,905 | $299,078 | $56,653 | $242,425 |
| 2016 | $6,180 | $297,182 | $0 | $0 |
| 2015 | $7,473 | $370,019 | $0 | $0 |
| 2014 | $6,857 | $351,140 | $0 | $0 |
Source: Public Records
Map
Nearby Homes
- TBD SE 59th Ave
- 0 Larch Radial Course
- 0 Larch Cse
- 327 Larch Rd
- 6170 SE 85th Ln
- 5 Larch Course Terrace
- 9 Juniper Pass Trail
- -0- Juniper Pass Dr
- 1 Juniper Trail Run
- 8821 Juniper Rd
- 8795 Juniper Rd
- 32 Juniper Trail
- 27 Juniper Pass Way
- 5515 SE 91st St
- 0 Juniper Trail Unit MFROM709600
- 38 Juniper Pass Dr
- 31 Juniper Pass Dr
- 39 Juniper Pass Ln
- 5547 SE 91st Place
- 36 Juniper Pass Ln
- 8721 SE 58th Ave Unit 4
- 8721 SE 58th Ave Unit 3
- 8721 SE 58th Ave Unit 5
- 8721 SE 58th Ave
- 8622 SE 59th Ave
- 0 SE 59th Ave
- 5891 SE 88th St
- 8733 SE 59th Ave
- 8753 SE 59th Ave
- 8783 SE 59th Ave
- 8760 SE 60 Ave
- 8740 SE 60th Ave
- 8760 SE 60th Ave
- 4 Larch Track
- 340 Larch Rd
- 5981 SE 88th St
- 5 Larch Track
- 8653 SE 59th Ave
- 338 Larch Rd
- 0 Larch Track Unit T3425701