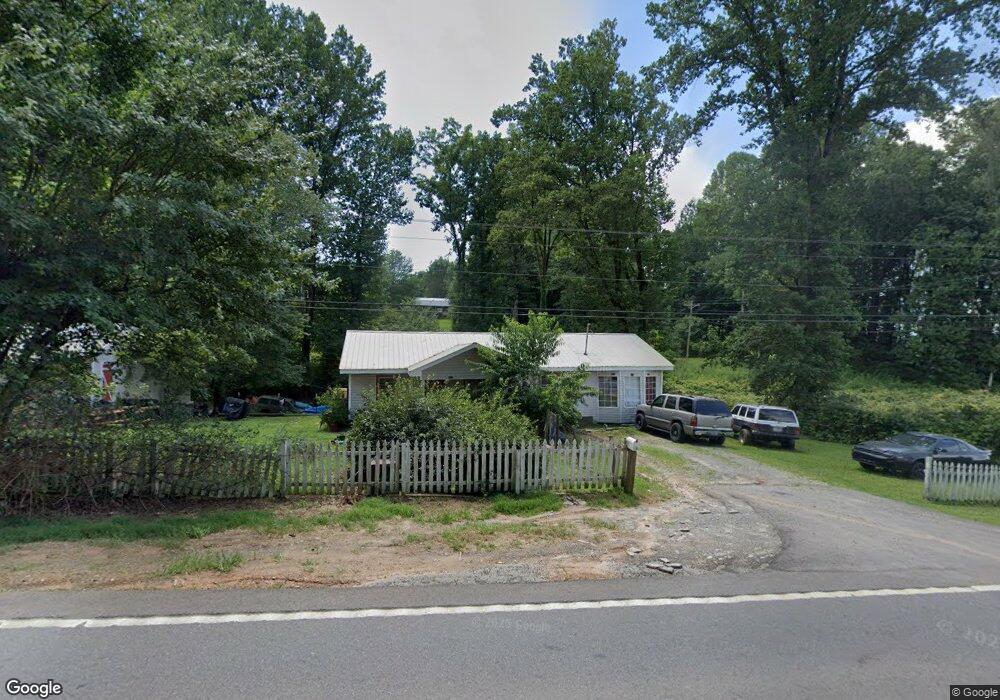
8724 Highway 52 E Ellijay, GA 30536
Estimated Value: $209,787 - $626,000
2
Beds
2
Baths
1,157
Sq Ft
$351/Sq Ft
Est. Value
About This Home
This home is located at 8724 Highway 52 E, Ellijay, GA 30536 and is currently estimated at $406,197, approximately $351 per square foot. 8724 Highway 52 E is a home located in Gilmer County with nearby schools including Ellijay Elementary School, Clear Creek Elementary School, and Clear Creek Middle School.
Ownership History
Date
Name
Owned For
Owner Type
Purchase Details
Closed on
Jan 29, 2008
Sold by
Lafayette Anzie
Bought by
Patterson James Robert
Current Estimated Value
Purchase Details
Closed on
Dec 12, 2003
Sold by
Regions Bank
Bought by
Lafayette Anzie
Purchase Details
Closed on
Oct 27, 2003
Sold by
Fowler James E
Bought by
Regions Bank
Purchase Details
Closed on
May 30, 2003
Sold by
Fowler James E
Bought by
Jones Johnny J
Purchase Details
Closed on
Jun 1, 1999
Sold by
Fields Carolyn A and Fields L
Bought by
Fowler James E
Purchase Details
Closed on
Jul 1, 1998
Sold by
Fields Carolyn A
Bought by
Fields Carolyn A and Fields L
Purchase Details
Closed on
Sep 1, 1996
Sold by
Fields Carolyn A and Fields L
Bought by
Fields Carolyn A and Fields L
Purchase Details
Closed on
Nov 1, 1994
Sold by
Fields Carolyn A and Fields L
Bought by
Fields Carolyn A and Fields L
Create a Home Valuation Report for This Property
The Home Valuation Report is an in-depth analysis detailing your home's value as well as a comparison with similar homes in the area
Home Values in the Area
Average Home Value in this Area
Purchase History
| Date | Buyer | Sale Price | Title Company |
|---|---|---|---|
| Patterson James Robert | $101,259 | -- | |
| Lafayette Anzie | $55,000 | -- | |
| Regions Bank | -- | -- | |
| Fowler James E | -- | -- | |
| Jones Johnny J | -- | -- | |
| Fowler James E | $46,000 | -- | |
| Fields Carolyn A | -- | -- | |
| Fields Carolyn A | $32,300 | -- | |
| Fields Carolyn A | $32,000 | -- |
Source: Public Records
Tax History Compared to Growth
Tax History
| Year | Tax Paid | Tax Assessment Tax Assessment Total Assessment is a certain percentage of the fair market value that is determined by local assessors to be the total taxable value of land and additions on the property. | Land | Improvement |
|---|---|---|---|---|
| 2025 | $844 | $65,952 | $4,720 | $61,232 |
| 2024 | $844 | $66,524 | $4,280 | $62,244 |
| 2023 | $865 | $65,844 | $3,600 | $62,244 |
| 2022 | $853 | $56,044 | $3,600 | $52,444 |
| 2021 | $822 | $44,804 | $3,160 | $41,644 |
| 2020 | $749 | $35,940 | $3,080 | $32,860 |
| 2019 | $772 | $35,940 | $3,080 | $32,860 |
| 2018 | $782 | $35,940 | $3,080 | $32,860 |
| 2017 | $702 | $30,400 | $3,080 | $27,320 |
| 2016 | $735 | $31,160 | $3,080 | $28,080 |
| 2015 | $624 | $27,240 | $1,320 | $25,920 |
| 2014 | $625 | $26,320 | $1,320 | $25,000 |
| 2013 | -- | $28,000 | $1,600 | $26,400 |
Source: Public Records
Map
Nearby Homes
- 3214 Lower Cartecay Rd
- 140 Robert Dr
- 1030 Hefner Lake Rd
- 83 Licklog Rd
- 31&32 Fox Paw Leaf Ln
- LOT 26 Fox Paw Leaf Ln
- 0 Foxpaw Leaf Ln Unit LOT 20
- 0 Foxpaw Leaf Ln Unit 38
- 0 Foxpaw Leaf Ln Unit 7675080
- 0 Foxpaw Leaf Ln Unit 7675161
- 0 Foxpaw Leaf Ln Unit 420583
- 74 Sam Allen Mountain Rd
- 0 Oval Leaf Ln Unit 419179
- Lot 10 Cartecay River Run
- 450 Cartecay River Run Unit 18
- 450 Cartecay River Run
- 418 Cartecay River Run
- 418 Cartecay River Run Unit 20
- Lot 9 Eastview Trail
- 0 Black Bear Ridge Rd Unit 10450118
- 8730 Highway 52 E
- 3093 Lower Cartecay Rd
- LT75 Bluffs of Cartecay
- LT75 Bluffs of Cartecay Unit Lot 75
- 8726 52 E
- 8771 Highway 52 E
- 3153 Lower Cartecay Rd
- 8685 Highway 52 E
- 8726 Highway 52 E
- 8726 Highway 52 E
- 8726 Hwy 52 E
- 8726 Highway 52 E
- 3187 Lower Cartecay Rd
- 3096 Lower Cartecay Rd
- 3046 Lower Cartecay Rd
- 3213 Lower Cartecay Rd
- 2920 Lower Cartecay Rd
- 2871 Lower Cartecay Rd
- 8916 Highway 52 E
- 8607 Highway 52 E