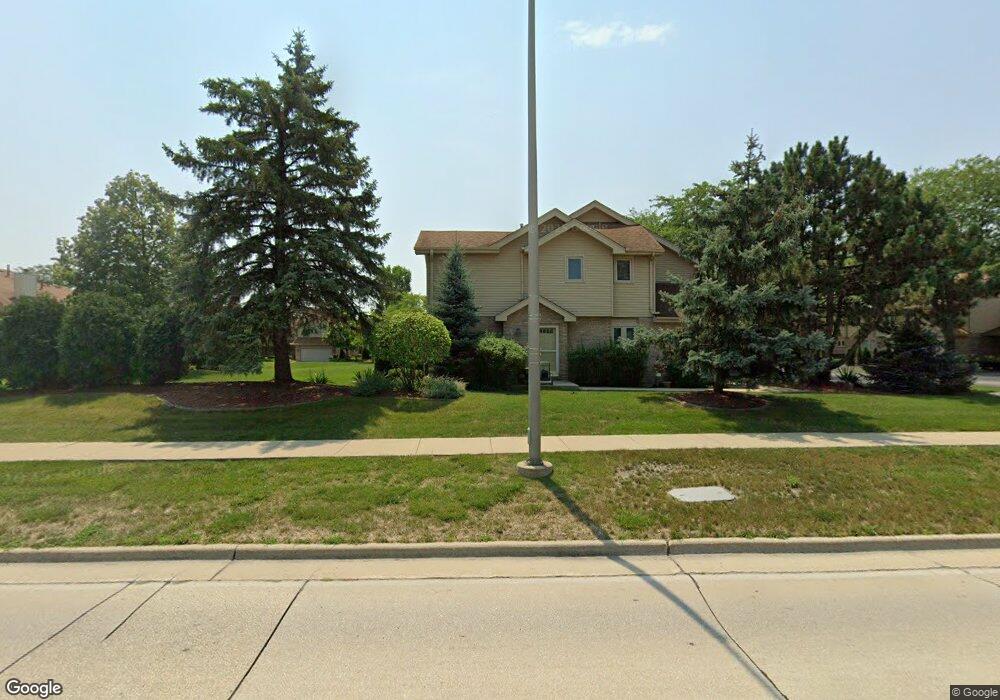
8725 Margaret Ln Tinley Park, IL 60487
Central Tinley Park NeighborhoodEstimated Value: $316,000 - $371,000
2
Beds
3
Baths
1,490
Sq Ft
$230/Sq Ft
Est. Value
About This Home
This home is located at 8725 Margaret Ln, Tinley Park, IL 60487 and is currently estimated at $343,113, approximately $230 per square foot. 8725 Margaret Ln is a home located in Cook County with nearby schools including Christa Mcauliffe School, Prairie View Middle School, and Victor J Andrew High School.
Ownership History
Date
Name
Owned For
Owner Type
Purchase Details
Closed on
May 25, 2000
Sold by
Mccarthy Carol A
Bought by
Memishofski Sabri and Memishofski Selime
Current Estimated Value
Home Financials for this Owner
Home Financials are based on the most recent Mortgage that was taken out on this home.
Original Mortgage
$90,000
Interest Rate
8.31%
Mortgage Type
Balloon
Purchase Details
Closed on
Apr 30, 1999
Sold by
Zene Raymond T and Zene Angie E
Bought by
Mccarthy Carol A
Home Financials for this Owner
Home Financials are based on the most recent Mortgage that was taken out on this home.
Original Mortgage
$148,650
Interest Rate
6.99%
Purchase Details
Closed on
Feb 21, 1997
Sold by
Morgan John H and Morgan Karen A
Bought by
Zene Raymond T and Zene Angie E
Home Financials for this Owner
Home Financials are based on the most recent Mortgage that was taken out on this home.
Original Mortgage
$78,000
Interest Rate
7.93%
Create a Home Valuation Report for This Property
The Home Valuation Report is an in-depth analysis detailing your home's value as well as a comparison with similar homes in the area
Home Values in the Area
Average Home Value in this Area
Purchase History
| Date | Buyer | Sale Price | Title Company |
|---|---|---|---|
| Memishofski Sabri | $160,000 | -- | |
| Mccarthy Carol A | $156,500 | -- | |
| Zene Raymond T | $159,000 | -- |
Source: Public Records
Mortgage History
| Date | Status | Borrower | Loan Amount |
|---|---|---|---|
| Closed | Memishofski Sabri | $90,000 | |
| Previous Owner | Mccarthy Carol A | $148,650 | |
| Previous Owner | Zene Raymond T | $78,000 |
Source: Public Records
Tax History Compared to Growth
Tax History
| Year | Tax Paid | Tax Assessment Tax Assessment Total Assessment is a certain percentage of the fair market value that is determined by local assessors to be the total taxable value of land and additions on the property. | Land | Improvement |
|---|---|---|---|---|
| 2024 | $6,853 | $28,000 | $1,067 | $26,933 |
| 2023 | $5,367 | $28,000 | $1,067 | $26,933 |
| 2022 | $5,367 | $18,474 | $928 | $17,546 |
| 2021 | $5,225 | $18,473 | $927 | $17,546 |
| 2020 | $5,166 | $18,473 | $927 | $17,546 |
| 2019 | $5,225 | $19,540 | $834 | $18,706 |
| 2018 | $5,111 | $19,540 | $834 | $18,706 |
| 2017 | $4,994 | $19,540 | $834 | $18,706 |
| 2016 | $4,898 | $17,245 | $742 | $16,503 |
| 2015 | $4,804 | $17,245 | $742 | $16,503 |
| 2014 | $4,781 | $17,245 | $742 | $16,503 |
| 2013 | $4,983 | $19,129 | $742 | $18,387 |
Source: Public Records
Map
Nearby Homes
- 8548 Bethany Ln
- 8721 W 169th St
- 17324 Humber Ln
- 8543 Carriage Ln
- 8750 W 169th St
- 17230 Shetland Dr
- 8456 170th Place
- 17155 Kamp Ct Unit 9
- 8710 W 168th St
- 16950 90th Ave
- 16813 89th Ave
- 8444 W 171st St
- 16805 Hilltop Ave
- Fremont Plan at Radcliffe Place
- Calysta Plan at Radcliffe Place
- Danbury Plan at Radcliffe Place
- Briarcliffe Plan at Radcliffe Place
- Eden Plan at Radcliffe Place
- Amberwood Plan at Radcliffe Place
- 16753 Hilltop Ave
- 8729 Margaret Ln
- 8729 Margaret Ln Unit 8729
- 8721 Margaret Ln
- 8717 Margaret Ln
- 8713 Margaret Ln
- 17115 Jeremy Ln
- 8712 Kathleen Ln Unit 18109
- 8706 Kathleen Ln
- 8709 Margaret Ln
- 8718 Kathleen Ln
- 17126 Jeremy Ln
- 17130 Jeremy Ln
- 17111 Jeremy Ln
- 17122 Jeremy Ln
- 17118 Jeremy Ln
- 8705 Margaret Ln
- 8700 Kathleen Ln
- 8724 Kathleen Ln
- 17107 Jeremy Ln
- 17107 Jeremy Ln Unit 2