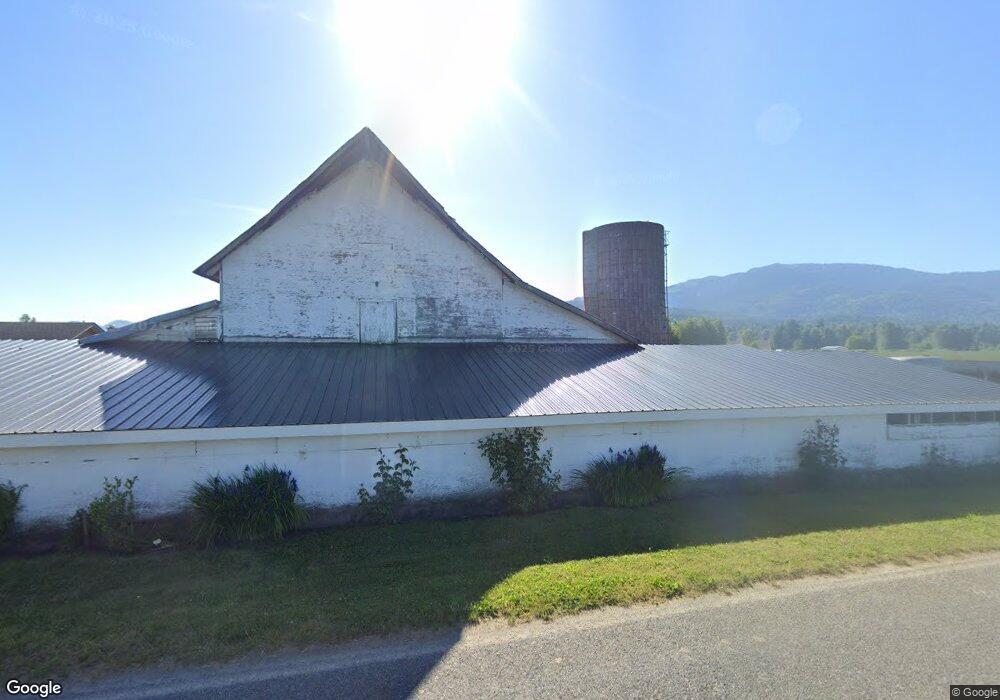
8726 Garrison Rd Everson, WA 98247
Estimated Value: $533,345 - $662,000
4
Beds
2
Baths
2,068
Sq Ft
$289/Sq Ft
Est. Value
About This Home
This home is located at 8726 Garrison Rd, Everson, WA 98247 and is currently estimated at $597,673, approximately $289 per square foot. 8726 Garrison Rd is a home located in Whatcom County with nearby schools including Sumas Elementary School, Nooksack Elementary School, and Everson Elementary School.
Ownership History
Date
Name
Owned For
Owner Type
Purchase Details
Closed on
Jan 29, 2004
Sold by
Pelleboer Harry and Pelleboer Jeannie
Bought by
Bruland Norman J and Bruland Catherine N
Current Estimated Value
Home Financials for this Owner
Home Financials are based on the most recent Mortgage that was taken out on this home.
Original Mortgage
$152,000
Outstanding Balance
$68,882
Interest Rate
5.79%
Mortgage Type
Purchase Money Mortgage
Estimated Equity
$528,791
Purchase Details
Closed on
Jan 16, 2002
Sold by
Pelleboer Hary and Pelleboer Herman Ralph
Bought by
Pelleboer Harry and Pelleboer Jeannie
Home Financials for this Owner
Home Financials are based on the most recent Mortgage that was taken out on this home.
Original Mortgage
$105,500
Interest Rate
7.11%
Create a Home Valuation Report for This Property
The Home Valuation Report is an in-depth analysis detailing your home's value as well as a comparison with similar homes in the area
Purchase History
| Date | Buyer | Sale Price | Title Company |
|---|---|---|---|
| Bruland Norman J | $163,314 | Chicago Title Insurance | |
| Pelleboer Harry | -- | First American Title Insuran |
Source: Public Records
Mortgage History
| Date | Status | Borrower | Loan Amount |
|---|---|---|---|
| Open | Bruland Norman J | $152,000 | |
| Previous Owner | Pelleboer Harry | $105,500 | |
| Closed | Bruland Norman J | $38,000 |
Source: Public Records
Tax History
| Year | Tax Paid | Tax Assessment Tax Assessment Total Assessment is a certain percentage of the fair market value that is determined by local assessors to be the total taxable value of land and additions on the property. | Land | Improvement |
|---|---|---|---|---|
| 2025 | $4,595 | $590,544 | $305,421 | $285,123 |
| 2024 | $3,737 | $580,566 | $302,397 | $278,169 |
| 2023 | $3,737 | $588,289 | $283,611 | $304,678 |
| 2022 | $3,302 | $529,998 | $255,509 | $274,489 |
| 2021 | $3,171 | $414,053 | $199,613 | $214,440 |
| 2020 | $2,769 | $247,849 | $66,120 | $181,729 |
| 2019 | $2,346 | $316,741 | $152,699 | $164,042 |
| 2018 | $2,877 | $213,663 | $57,000 | $156,663 |
| 2017 | $2,484 | $196,746 | $35,760 | $160,986 |
| 2016 | $2,478 | $175,289 | $31,860 | $143,429 |
| 2015 | $2,063 | $175,289 | $31,860 | $143,429 |
| 2014 | -- | $168,471 | $33,281 | $135,190 |
| 2013 | -- | $165,575 | $32,546 | $133,029 |
Source: Public Records
Map
Nearby Homes
- 4135 Kamphouse Dr
- 705 E 6th St
- 8146 Watkins Rd
- 512 Allison Way
- 303 Hayes St
- 407 E 2nd St
- 1305 Boon St Unit 209
- 1305 Boon St Unit 213
- 1116 Sumas Ave Unit 1
- 1116 Sumas Ave Unit 2
- 3292 S Pass Rd
- 412 W 3rd St
- 404 W 3rd St
- 308 W 3rd St
- 209 Nooksack Ave
- 304 W 3rd St
- 109 W 2nd St
- 107 Thendara Park Dr Unit C
- 208 Harrison St
- 7554 Nooksack Rd
- 8731 Garrison Rd
- 8765 Garrison Rd
- 8601 N Telegraph Rd
- 8847 Garrison Rd
- 8651 N Telegraph Rd
- 3721 E Badger Rd
- 3657 E Badger Rd
- 3650 E Badger Rd
- 8564 N Telegraph Rd
- 8676 N Telegraph Rd
- 3660 Lindsay Rd
- 3796 Lindsay Rd
- 8746 N Telegraph Rd
- 3873 E Badger Rd
- 3745 Lindsay Rd
- 3683 Lindsay Rd
- 3695 Lindsay Rd
- 3653 Lindsay Rd
- 8799 N Telegraph Rd
Your Personal Tour Guide
Ask me questions while you tour the home.