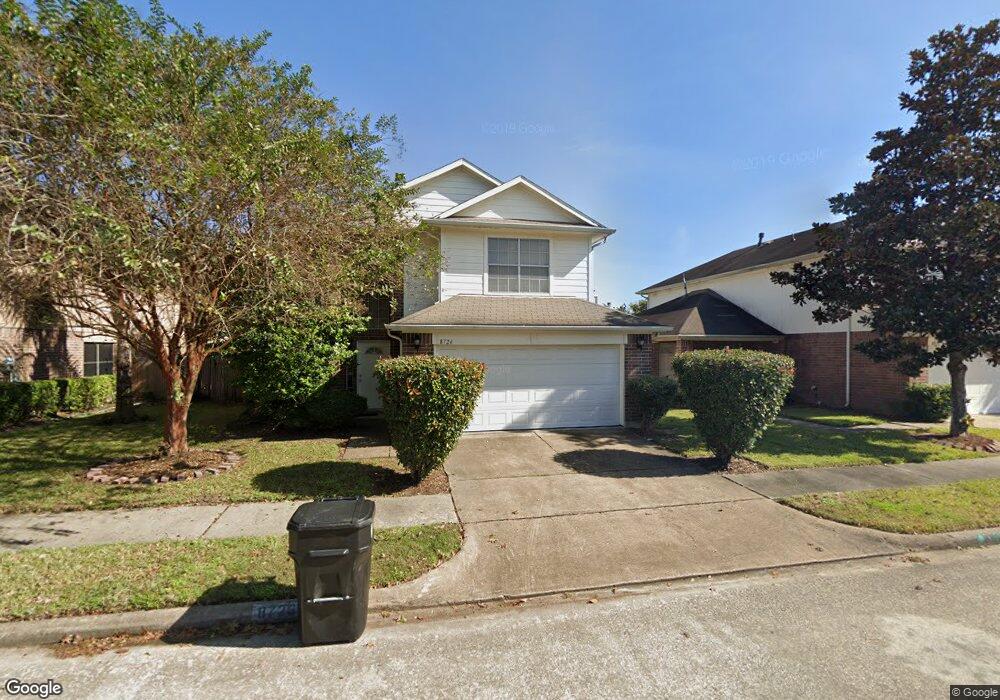
8726 Wild Basin Dr Houston, TX 77088
Greater Inwood NeighborhoodEstimated Value: $231,000 - $257,130
4
Beds
3
Baths
2,090
Sq Ft
$117/Sq Ft
Est. Value
About This Home
This home is located at 8726 Wild Basin Dr, Houston, TX 77088 and is currently estimated at $244,033, approximately $116 per square foot. 8726 Wild Basin Dr is a home located in Harris County with nearby schools including Stovall School, Caraway Intermediate School, and Caraway Elementary School.
Ownership History
Date
Name
Owned For
Owner Type
Purchase Details
Closed on
Aug 13, 2017
Sold by
Pleasant John
Bought by
Pleasant Wanda
Current Estimated Value
Purchase Details
Closed on
Aug 9, 2002
Sold by
Hud
Bought by
Wesley Sheenia W
Home Financials for this Owner
Home Financials are based on the most recent Mortgage that was taken out on this home.
Original Mortgage
$90,000
Outstanding Balance
$38,220
Interest Rate
6.6%
Estimated Equity
$205,813
Purchase Details
Closed on
Oct 2, 2001
Sold by
Burton Jesse L and Burton Lanita
Bought by
Gmac Mtg Corp
Purchase Details
Closed on
Apr 6, 1998
Sold by
Tremont Custom Construction Company Inc
Bought by
Burton Jesse L
Home Financials for this Owner
Home Financials are based on the most recent Mortgage that was taken out on this home.
Original Mortgage
$94,729
Interest Rate
7.17%
Mortgage Type
FHA
Create a Home Valuation Report for This Property
The Home Valuation Report is an in-depth analysis detailing your home's value as well as a comparison with similar homes in the area
Home Values in the Area
Average Home Value in this Area
Purchase History
| Date | Buyer | Sale Price | Title Company |
|---|---|---|---|
| Pleasant Wanda | -- | None Available | |
| Wesley Sheenia W | -- | First American Title | |
| Gmac Mtg Corp | $99,188 | -- | |
| Burton Jesse L | -- | Texas American Title Company |
Source: Public Records
Mortgage History
| Date | Status | Borrower | Loan Amount |
|---|---|---|---|
| Open | Wesley Sheenia W | $90,000 | |
| Previous Owner | Burton Jesse L | $94,729 |
Source: Public Records
Tax History Compared to Growth
Tax History
| Year | Tax Paid | Tax Assessment Tax Assessment Total Assessment is a certain percentage of the fair market value that is determined by local assessors to be the total taxable value of land and additions on the property. | Land | Improvement |
|---|---|---|---|---|
| 2025 | $3,543 | $262,816 | $40,838 | $221,978 |
| 2024 | $3,543 | $261,739 | $40,838 | $220,901 |
| 2023 | $3,543 | $273,599 | $46,710 | $226,889 |
| 2022 | $4,458 | $235,802 | $31,140 | $204,662 |
| 2021 | $4,244 | $186,005 | $21,539 | $164,466 |
| 2020 | $4,054 | $153,593 | $21,539 | $132,054 |
| 2019 | $4,221 | $152,532 | $21,539 | $130,993 |
| 2018 | $1,651 | $140,000 | $21,539 | $118,461 |
| 2017 | $3,702 | $145,086 | $21,539 | $123,547 |
| 2016 | $3,365 | $127,678 | $21,539 | $106,139 |
| 2015 | $2,444 | $115,324 | $13,494 | $101,830 |
| 2014 | $2,444 | $109,755 | $13,494 | $96,261 |
Source: Public Records
Map
Nearby Homes
- 8803 Cold Lake Dr
- 8711 Wild Basin Dr
- 8518 Wild Basin Dr
- 8814 Woodcamp Dr
- 8510 Woodcamp Dr
- 7808 Inwood Grove Ln
- 7814 Inwood Grove Ln
- 7718 Inwood Grove Ln
- 7717 Inwood Hills Ln
- 7716 Inwood Grove Ln
- 3201 Stallings Dr
- 7712 Inwood Grove Ln
- 7709 Inwood Hills Ln
- 7702 Inwood Hills Ln
- 7707 Inwood Grove Ln
- 7705 Inwood Grove Ln
- 7611 Athlone Dr
- 0 Dollywright St Unit 49022715
- 0 Glenn Unit 90901807
- DOVE Plan at Alaia Crossing
- 8802 Wild Basin Dr
- 8722 Wild Basin Dr
- 8723 Cold Lake Dr
- 8718 Wild Basin Dr
- 8806 Wild Basin Dr
- 8719 Cold Lake Dr
- 8807 Cold Lake Dr
- 8727 Wild Basin Dr
- 8723 Wild Basin Dr
- 8810 Wild Basin Dr
- 8715 Cold Lake Dr
- 8803 Wild Basin Dr
- 8719 Wild Basin Dr
- 8811 Cold Lake Dr
- 8807 Wild Basin Dr
- 8711 Cold Lake Dr
- 8715 Wild Basin Dr
- 8710 Wild Basin Dr
- 8814 Wild Basin Dr
- 8815 Cold Lake Dr