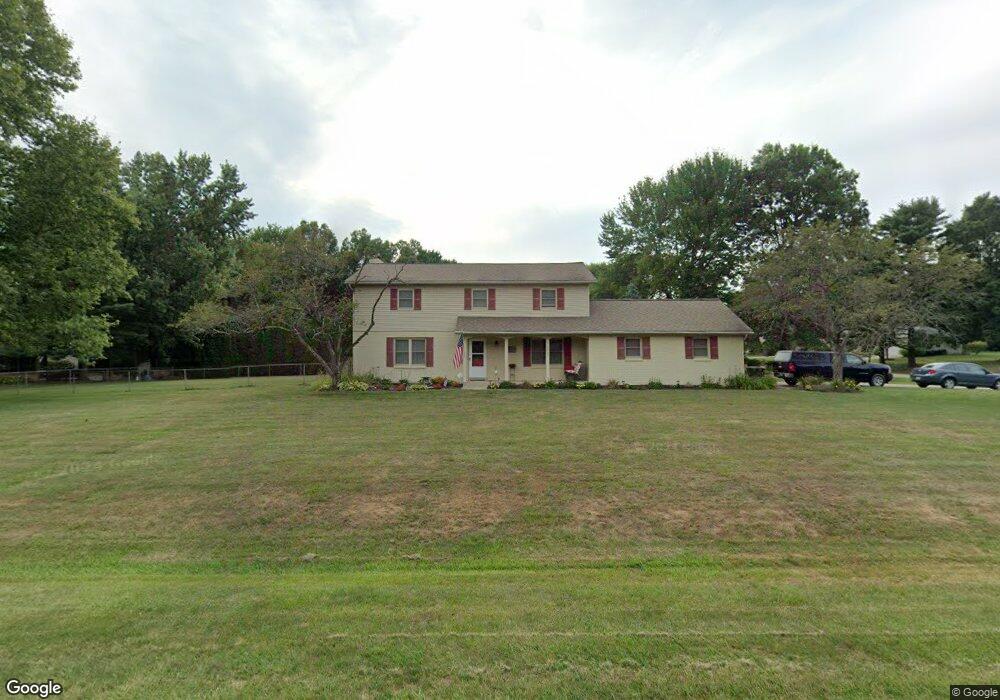
8727 Stonehenge Cir Pickerington, OH 43147
Estimated Value: $385,000 - $404,000
4
Beds
3
Baths
2,080
Sq Ft
$189/Sq Ft
Est. Value
About This Home
This home is located at 8727 Stonehenge Cir, Pickerington, OH 43147 and is currently estimated at $394,125, approximately $189 per square foot. 8727 Stonehenge Cir is a home located in Fairfield County with nearby schools including Toll Gate Elementary School, Pickerington Lakeview Junior High School, and Toll Gate Middle School.
Ownership History
Date
Name
Owned For
Owner Type
Purchase Details
Closed on
Aug 4, 2022
Sold by
Stevenson Robert B and Stevenson Lora L
Bought by
Robert And Lora Stevenson Living Trust
Current Estimated Value
Purchase Details
Closed on
Jun 19, 1998
Sold by
Oschman Stanley H
Bought by
Stevenson Robert B and Stevenson Lora L
Home Financials for this Owner
Home Financials are based on the most recent Mortgage that was taken out on this home.
Original Mortgage
$118,400
Interest Rate
7.22%
Mortgage Type
New Conventional
Purchase Details
Closed on
Aug 18, 1995
Sold by
Polko Thomas S
Bought by
Oschman Stanley H and Oschman Ruth E
Home Financials for this Owner
Home Financials are based on the most recent Mortgage that was taken out on this home.
Original Mortgage
$139,100
Interest Rate
7.63%
Mortgage Type
New Conventional
Purchase Details
Closed on
Oct 21, 1993
Sold by
Ceneskie Bruce C
Bought by
Polko Thomas S
Purchase Details
Closed on
Oct 1, 1986
Create a Home Valuation Report for This Property
The Home Valuation Report is an in-depth analysis detailing your home's value as well as a comparison with similar homes in the area
Home Values in the Area
Average Home Value in this Area
Purchase History
| Date | Buyer | Sale Price | Title Company |
|---|---|---|---|
| Robert And Lora Stevenson Living Trust | -- | Winkler Legal Llc | |
| Stevenson Robert B | $148,000 | -- | |
| Oschman Stanley H | $146,500 | -- | |
| Polko Thomas S | $121,000 | -- | |
| -- | $100,900 | -- |
Source: Public Records
Mortgage History
| Date | Status | Borrower | Loan Amount |
|---|---|---|---|
| Previous Owner | Stevenson Robert B | $118,400 | |
| Previous Owner | Oschman Stanley H | $139,100 |
Source: Public Records
Tax History Compared to Growth
Tax History
| Year | Tax Paid | Tax Assessment Tax Assessment Total Assessment is a certain percentage of the fair market value that is determined by local assessors to be the total taxable value of land and additions on the property. | Land | Improvement |
|---|---|---|---|---|
| 2024 | $11,461 | $96,720 | $17,540 | $79,180 |
| 2023 | $4,400 | $96,720 | $17,540 | $79,180 |
| 2022 | $4,414 | $96,720 | $17,540 | $79,180 |
| 2021 | $3,973 | $74,170 | $15,950 | $58,220 |
| 2020 | $4,017 | $74,170 | $15,950 | $58,220 |
| 2019 | $4,043 | $74,170 | $15,950 | $58,220 |
| 2018 | $3,707 | $53,040 | $15,950 | $37,090 |
| 2017 | $3,712 | $59,410 | $13,290 | $46,120 |
| 2016 | $3,691 | $59,410 | $13,290 | $46,120 |
| 2015 | $3,681 | $57,410 | $13,290 | $44,120 |
| 2014 | $3,634 | $57,410 | $13,290 | $44,120 |
| 2013 | $3,634 | $57,410 | $13,290 | $44,120 |
Source: Public Records
Map
Nearby Homes
- 8782 Stonehenge Dr NW
- 9230 Blacklick-Eastern Rd NW
- 8869 Chevington Chase Dr
- 13297 White Cross Dr NW
- 12965 Silverbrook Dr
- 138 Dusky Willow Dr
- 129 Dusky Willow Dr
- 9170 Bridle Terrace
- 150 Dusky Willow Dr
- 154 Dusky Willow Dr
- 156 Dusky Willow Dr
- 160 Dusky Willow Dr
- 162 Dusky Willow Dr
- 164 Dusky Willow Dr
- 133 Dusky Willow Dr
- 148 Dusky Willow Dr
- 137 Dusky Willow Dr
- 139 Dusky Willow Dr
- 143 Dusky Willow Dr
- 146 Dusky Willow Dr
- 8749 Stonehenge Cir
- 8736 Stonehenge Dr
- 13646 Stonehenge Cir
- 8734 Stonehenge Cir
- 13626 Stonehenge Cir
- 8771 Stonehenge Cir
- 8760 Stonehenge Dr
- 13668 Stonehenge Cir
- 8760 Stonehenge Dr NW
- 13608 Stonehenge Cir
- 8768 Stonehenge Cir
- 13590 Stonehenge Cir
- 8782 Stonehenge Dr
- 13690 Stonehenge Cir
- 13707 Stonehenge Cir
- 8793 Stonehenge Cir
- 8790 Stonehenge Cir
- 8804 Stonehenge Dr
- 13712 Stonehenge Cir
- 13655 Cobblestone Ln